
North America Organic Fertilizer Market Size

| Study Period | 2017 – 2030 |
| Base Year For Estimation | 2024 |
| Forecast Data Period | 2025 – 2030 |
| Market Size (2025) | USD 0.96 Billion |
| Market Size (2030) | USD 1.67 Billion |
| CAGR (2025 – 2030) | 11.77 % |
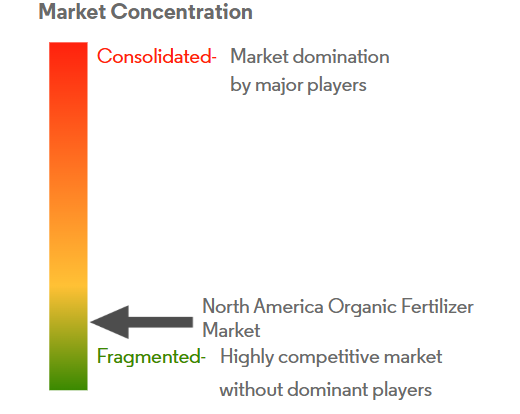
| Market Concentration | Low |
Major Players
*Disclaimer: Major Players sorted in no particular order |

North America Organic Fertilizer Market Analysis
The North America Organic Fertilizer Market size is estimated at 0.96 billion USD in 2025, and is expected to reach 1.67 billion USD by 2030, growing at a CAGR of 11.77% during the forecast period (2025-2030).
The North American organic fertilizer market is experiencing a significant transformation driven by sustainable agriculture practices and technological innovations. Leading manufacturers are implementing advanced production technologies to improve efficiency and reduce environmental impact. For instance, Cedar Grove Composting has integrated the GORE Cover and OdoWatch System technologies to effectively recycle over 350,000 metric tons of yard and food waste annually into nutrient-rich compost. Companies are increasingly adopting renewable energy solutions, exemplified by The Espoma Company’s 100% solar-powered manufacturing facility that covers 43,000 square feet of warehouse rooftops and saves more than 1.6 million pounds of greenhouse gas emissions annually.
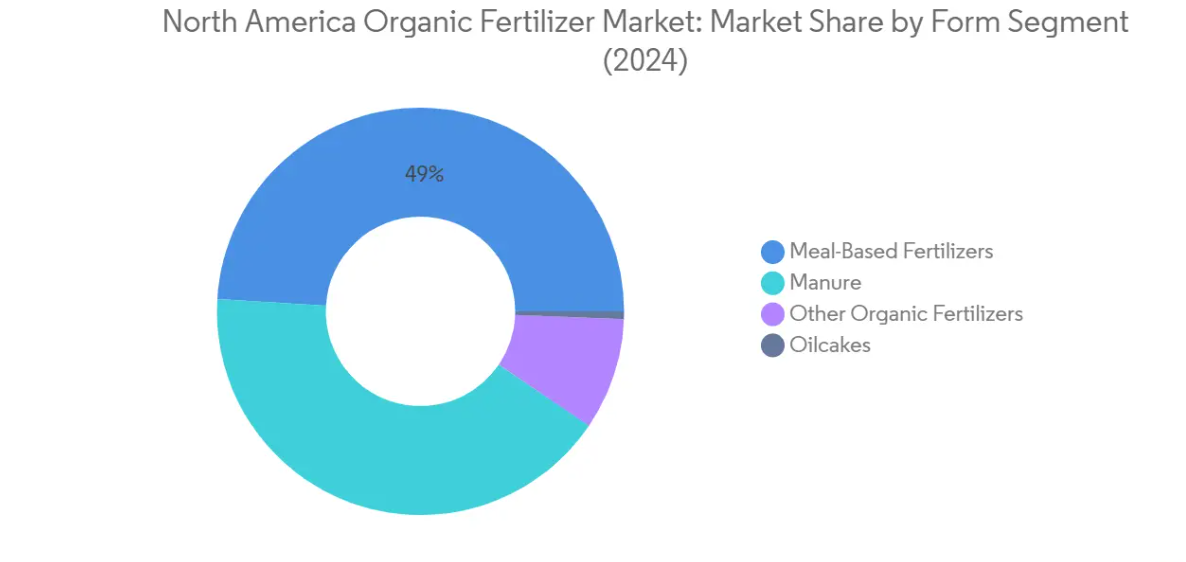
The market is witnessing significant product diversification and innovation in organic fertilizers formulations. Meal-based fertilizers, including blood meal, bone meal, and kelp meal, have emerged as the dominant category, accounting for 49.1% of the market share in 2022. These products are gaining popularity due to their high nutrient content and effectiveness in addressing specific crop requirements. Manufacturers are developing specialized blends that combine different natural fertilizers to create more effective and targeted nutrition solutions for various crop types and soil conditions.
Government support and investment in the organic sector are playing crucial roles in market development. Recent initiatives include Canada’s investment from the Ministry of Agriculture and Agri-Food in 2022 to support the sustainability and expansion of its organics sector. This partnership brings together three primary national organizations focusing on standards maintenance, scientific research, consumer and producer education, and market development. Similar initiatives across the region are strengthening the organic fertilizers supply chain and promoting sustainable farming practices.
The industry is experiencing notable advancements in production processes and quality control measures. Companies are implementing rigorous testing protocols, such as the Solvita test for measuring carbon dioxide and ammonia content in compost products. Manufacturing facilities are increasingly incorporating environmentally friendly practices, with companies like E.B. Stone & Sons installing wind turbines to power their production facilities and offices. These technological advancements and sustainable manufacturing practices are not only improving product quality but also reducing the environmental impact of bio fertilizers production.
North America Organic Fertilizer Market Trends
Organic produce demand grows in major countries like the United States, increasing cultivation area with government support
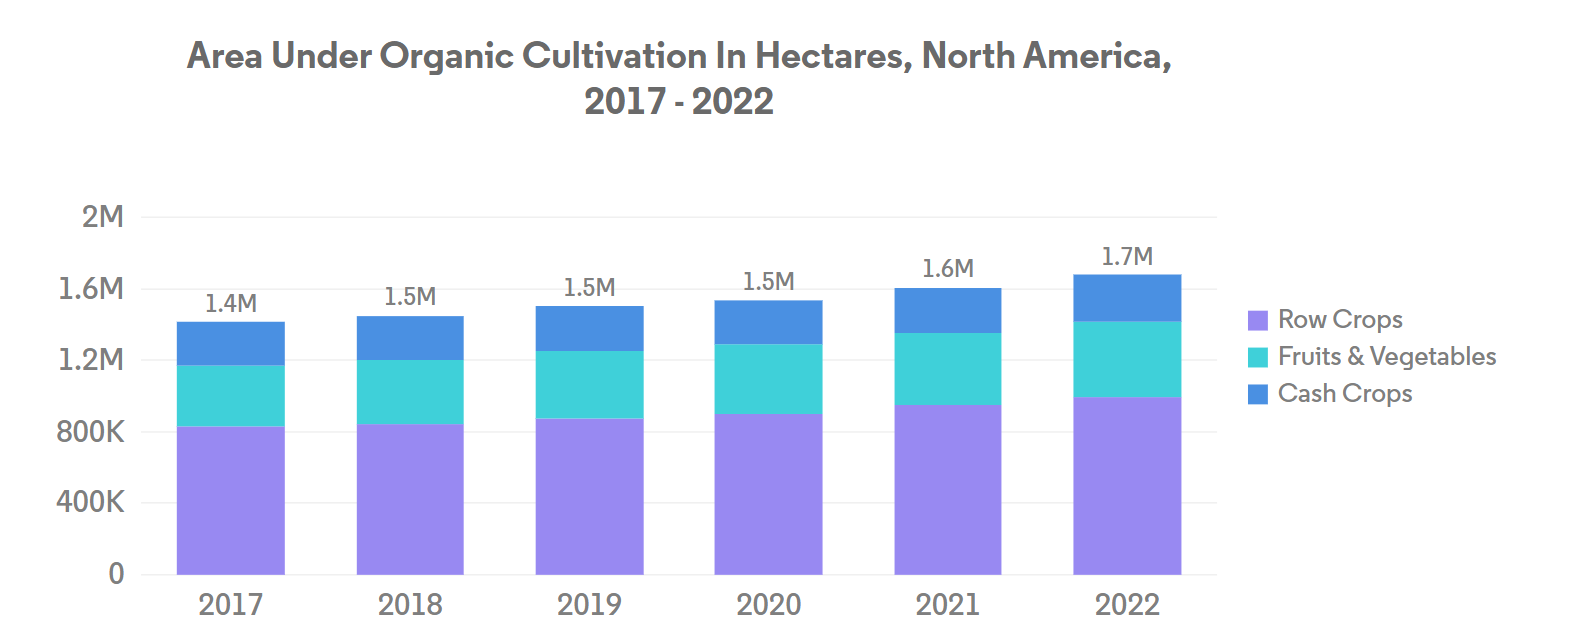
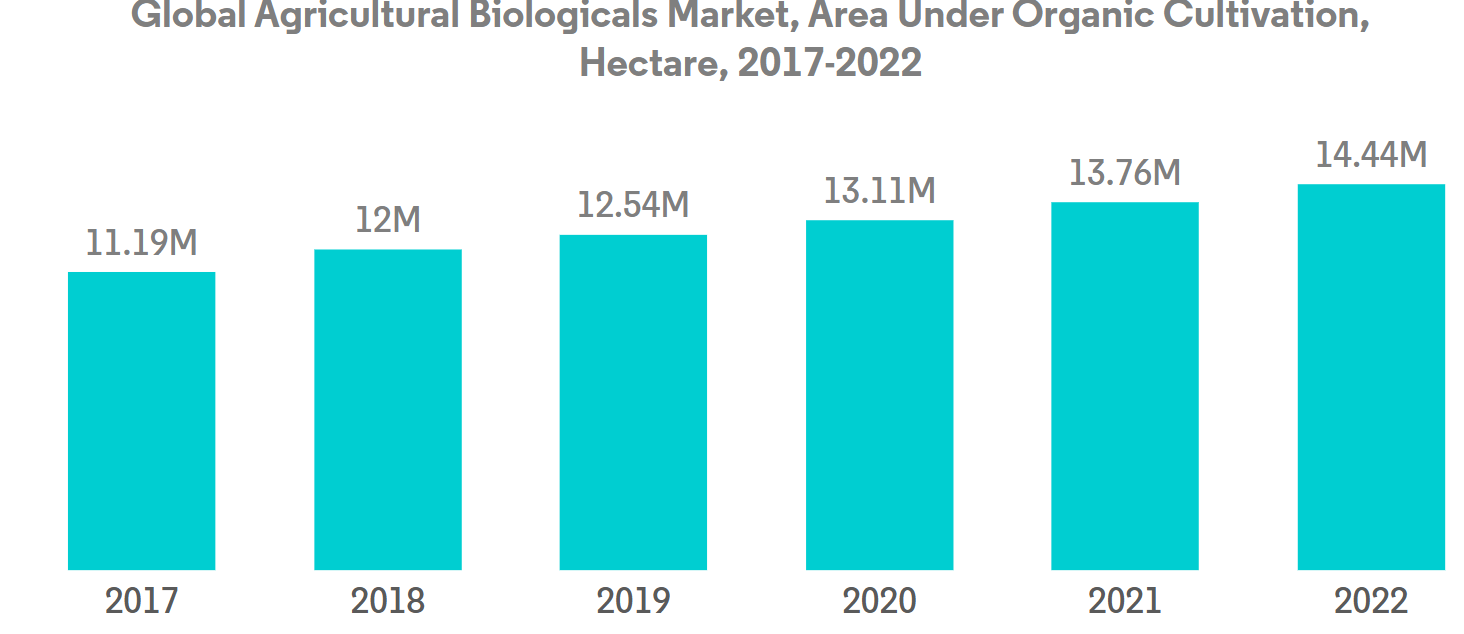
- The area under organic cultivation of crops in North America was recorded at 1.5 million hectares in 2021, according to the data provided by FibL statistics. The organic area in the region increased by 13.5% between 2017 and 2022. Among the North American countries, the United States was dominant, with 623.0 thousand hectares of agricultural land under organic farming, with California, Maine, and New York being the major states practicing agriculture.
- The United States is followed by Mexico, with 531.1 thousand hectares of area under organic farming in 2021. Mexico is among the top 20 organic food producers in the world. Mexico is the largest exporter of organic coffee in the world, according to Global Coffee Masters data. The country has the largest area under organic coffee production and even in terms of the number of organic coffee producers in the country. The major organic food-producing states in the country include Chiapas, Oaxaca, Michoacán, Chihuahua, and Guerrero, which accounted for 80.0% of the total organic area in the country in 2021. Organizations such as National Association for Organic Agriculture promote organic agriculture in the country, which is expected to motivate more farmers to take up organic agriculture. In addition to financial assistance, the Mexican government supports research and development activities to help promote organic agriculture.
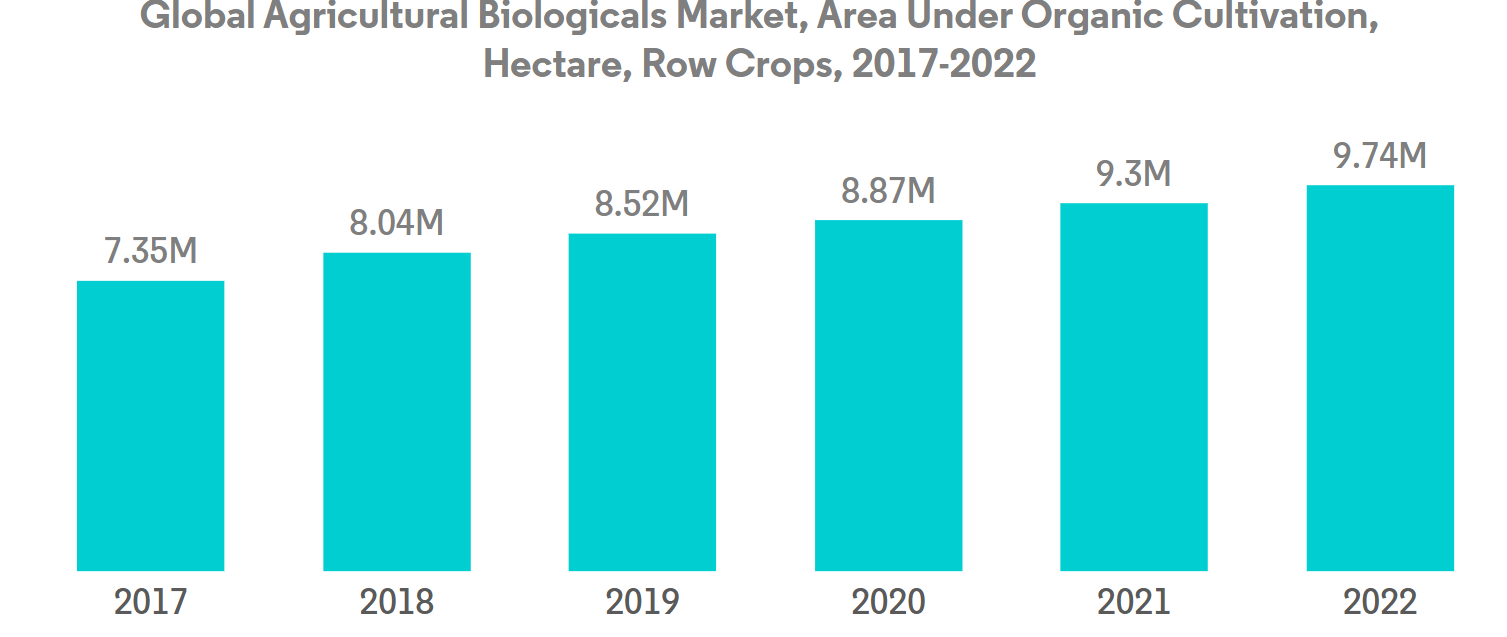
- Canada’s area under organic crop cultivation increased from 0.40 million hectares in 2017 to 0.45 million hectares in 2021. Row crops occupied the maximum area with 0.42 million hectares in 2021. The Canadian government announced a sum of USD 297,330 in 2021 as Organic Development Fund to support organic farmers. These initiatives are expected to increase the organic area in the region.
Growing demand for organic produce in domestic and international markets, rise in per capita spending on organic food
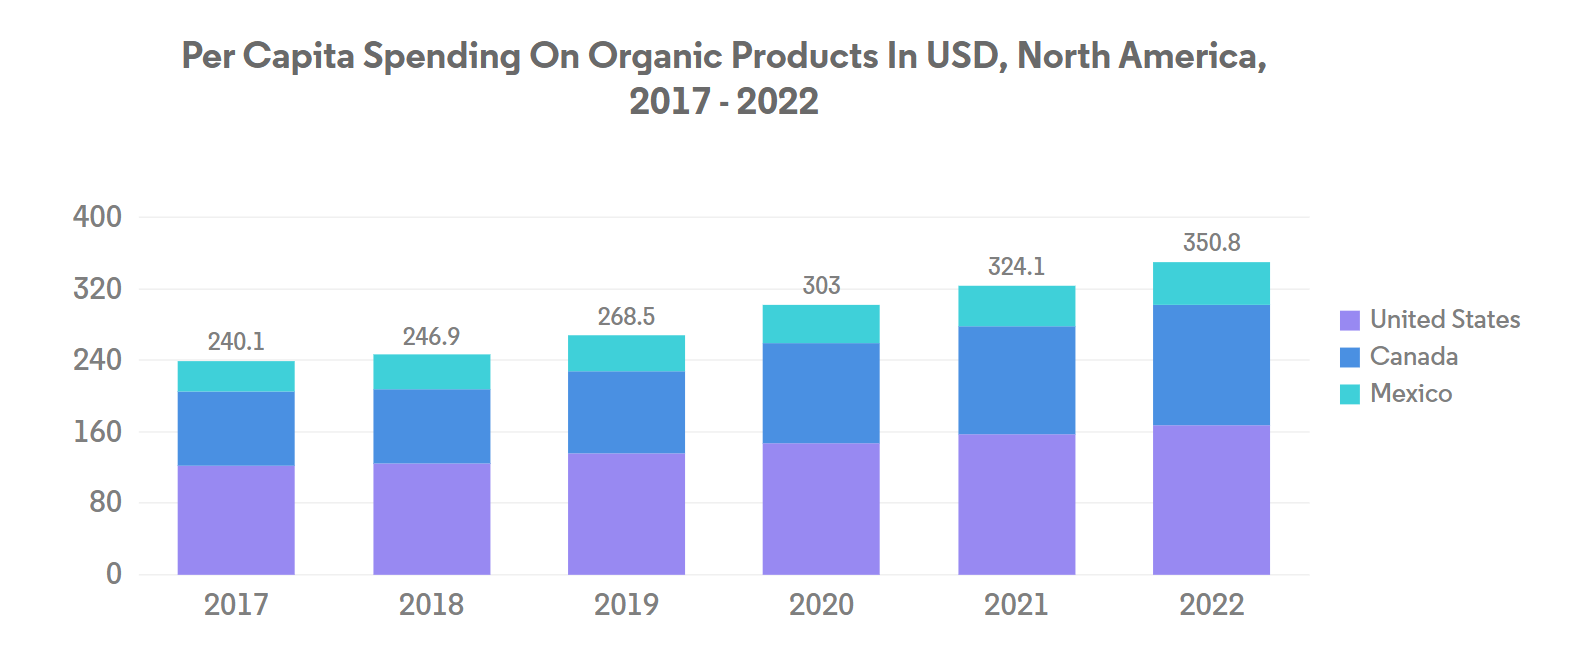
- North America’s average per capita spending on organic food products was USD 109.7 in 2021. The per capita spending in the United States is the highest among the North American countries, with average spending of USD 186.7 in 2021. The sales of organic products in the United States crossed USD 63.00 billion in 2021. Organic Tarde Association accounted for a 2.0% increase over the previous year, with organic food sales at USD 57.5 billion in 2021. Organic fruits and vegetables accounted for 15.0% of the total organic product sales, valued at USD 21.0 billion in 2021.
- Organic food sales in Canada reached a value of USD 8.10 billion in 2020, as per the data reported by the Organic Federation of Canada. It is reported that Canada is the 6th largest market in the world for Organic products, with the supply of organic products failing to keep up with the demand in the country. The average spending on organic food per person was USD 142.6 in 2021. Increasing government support to retailers is expected to increase the availability, accessibility, and affordability of organic products in the country. Organic Tarde Association estimated the organic products market in Canada to grow and register a CAGR of 6.3% between 2021 and 2026.
- In 2021, Mexico registered a market size of USD 63.0 million for organic products with a global rank of 35. It is estimated to grow and register a CAGR of 7.2% between 2021 and 2026. However, the per capita spending on organic products in the country is less than in other countries in the region, with a value of USD 0.49 in 2021. More players entering the market in Mexico are expected to increase the demand for organic products in the country.
Segment Analysis: Form
Meal-Based Fertilizers Segment in North America Organic Fertilizer Market
Meal-based fertilizers dominate the North American organic fertilizer market, accounting for approximately 49% of the market share in 2024. These dry, single-ingredient supplements, including blood meal, bone meal, and kelp meal, are particularly popular due to their high nutrient content and slow-release properties. Blood meal fertilizers provide high nitrogen content, while bone meal fertilizers offer an optimal NPK ratio of 3:15:0, making them especially suitable for perennial crops. The segment’s dominance is largely attributed to their effectiveness in row crops, which represent about 40% of consumption, while horticultural crops account for roughly 21% of usage. These fertilizers are particularly valued for their ability to correct long-term nutrient deficiencies in the soil while feeding soil microorganisms, making them a sustainable and environmentally friendly option for organic farming.
Manure Segment in North America Organic Fertilizer Market
The manure segment is experiencing the strongest growth trajectory in the North American organic fertilizer market, projected to grow at approximately 12% CAGR from 2024 to 2029. This robust growth is driven by the increasing adoption of green manures, farmyard manure (FYM), and compost manure across various agricultural applications. The segment’s growth is supported by manure’s cost-effectiveness and its ability to provide a balanced combination of essential nutrients, including nitrogen, phosphate, and potassium. Farmers particularly value manure fertilizers for their dual benefits of nutrient provision and soil structure improvement, including enhanced water-holding capacity. The segment’s expansion is further bolstered by the growing area under organic field crops and the increasing awareness of sustainable farming practices among North American farmers.
Remaining Segments in Form Segmentation
The oilcakes and other organic fertilizer segments complete the market landscape, each offering unique benefits to organic farming practices. Oilcakes, produced as byproducts of oil extraction from oilseeds, provide concentrated nutrient sources and are particularly effective in managing root-knot nematodes in various crops. The other organic fertilizers category, which includes innovative solutions like fish guano, bat guano, fish emulsion, and vermicompost, is gaining traction due to their specialized applications and environmental benefits. These segments are particularly important in diversifying organic fertilizer options and meeting specific crop requirements, contributing to the overall sustainability of organic farming practices in North America.
Segment Analysis: Crop Type
Row Crops Segment in North America Organic Fertilizer Market
Row crops dominate the North American organic fertilizers market, commanding approximately 52% of the total market share in 2024. This significant market position is attributed to the extensive area under organic row crop cultivation, particularly in the United States and Canada, which collectively account for over 870,000 hectares. The segment’s prominence is driven by major crops, including corn, soybeans, canola, wheat, barley, alfalfa, oats, and rice. Manures are the most utilized natural fertilizers in row crop cultivation, accounting for nearly 49% of the total consumption, primarily due to their ease of application and cost-effectiveness. The United States leads in organic field crop cultivation, followed by Canada, with these two countries maintaining robust organic farming practices and supportive agricultural policies that promote sustainable farming methods.
Horticultural Crops Segment in North America Organic Fertilizer Market
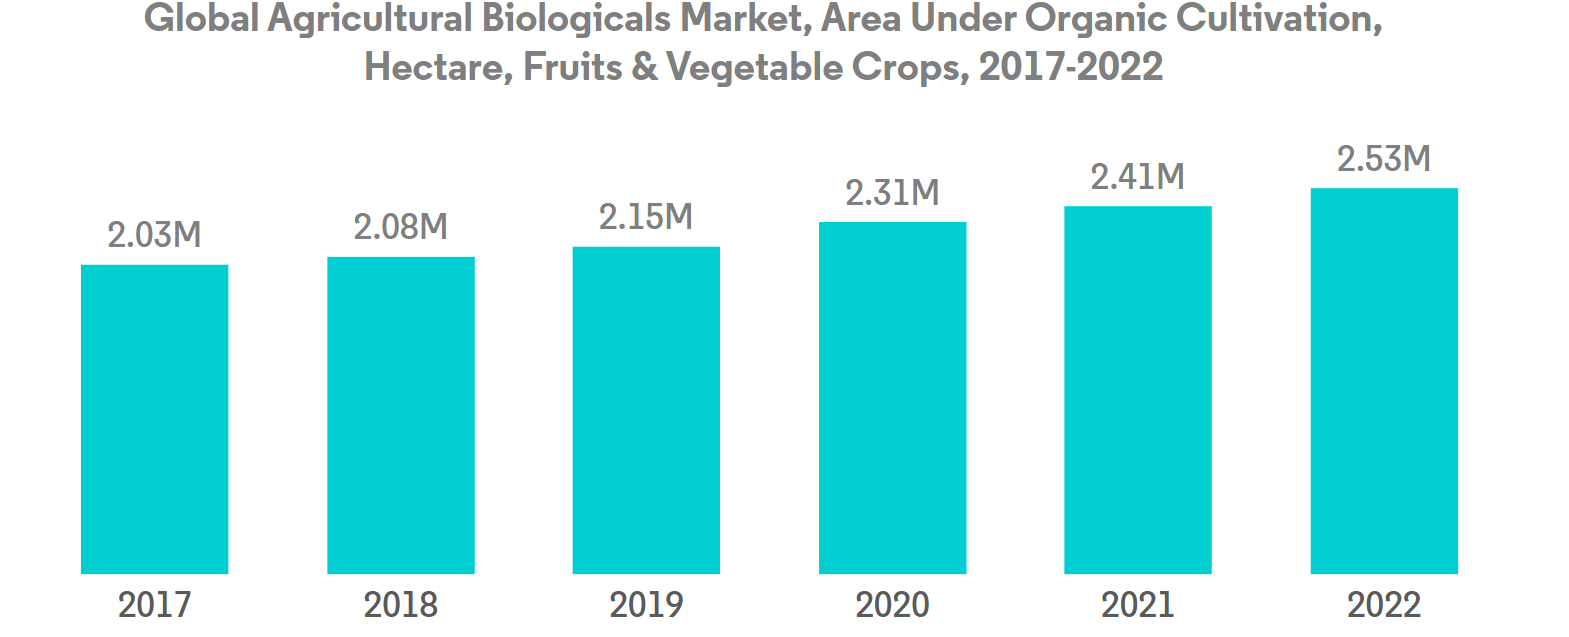
The horticultural crops segment in the North American bio fertilizers market is experiencing substantial growth, with a projected growth rate of approximately 12% from 2024 to 2029. This growth is primarily driven by the increasing demand for organic fruits, vegetables, and specialty crops across the region. Mexico has emerged as a leader in organic horticultural crop cultivation, accounting for about 54% of North America’s total horticultural organic crop area. The segment’s growth is further supported by the rising adoption of organic farming practices in high-value crops such as potatoes, tomatoes, lettuce, peppers, watermelons, grapes, and blueberries. The increasing consumer preference for organic produce, coupled with government initiatives supporting organic farming practices, continues to drive the expansion of this segment across North America.
Remaining Segments in Crop Type
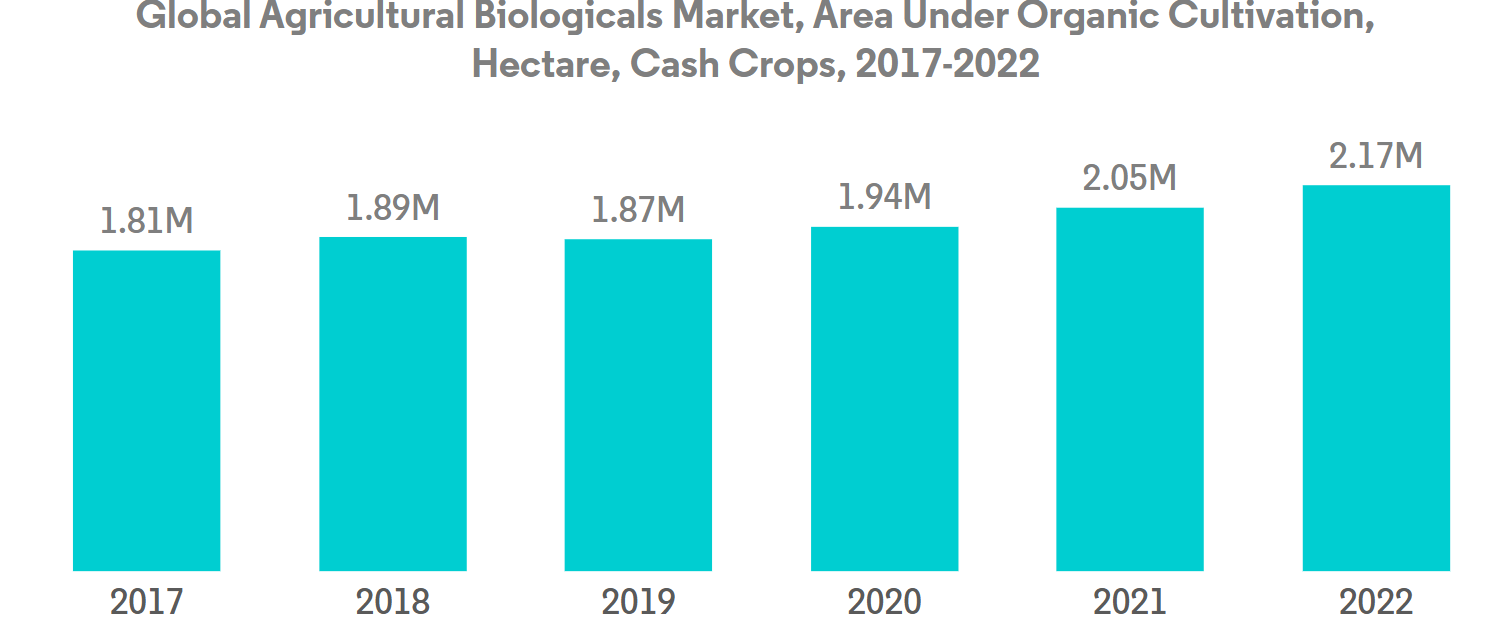
The cash crops segment plays a vital role in the North American organic fertilizer market, encompassing important crops such as cotton, sugarcane, coffee, tobacco, cocoa, and tea. This segment is particularly significant in Mexico, which has established itself as a major producer of organic coffee and other specialty cash crops. The segment’s development is supported by specialized organic fertilizer applications, with meal-based fertilizers being the predominant choice among cash crop farmers. The unique requirements of these high-value crops have led to the development of specialized organic fertilizer formulations that cater to their specific nutritional needs while maintaining soil health and productivity.
North America Organic Fertilizer Market Geography Segment Analysis
North America Organic Fertilizer Market in United States
The United States dominates the North American organic fertilizer market, commanding approximately 41% of the total market value in 2024. The country’s leadership position is built on its extensive organic cultivation area and robust agricultural infrastructure. Manure remains the most widely used organic fertilizers in the United States, accounting for a significant portion of consumption due to its cost-effectiveness and soil-enhancing properties. The country’s organic fertilizer market is supported by a well-developed regulatory framework, with the Environmental Protection Agency and the Association of American Plant Food Control Officials ensuring proper standards and safety measures. The presence of major manufacturers and a strong distribution network further strengthens the market position. States like California, Maine, and New York are at the forefront of organic farming practices, driving substantial demand for organic fertilizers. The market is experiencing a transformation with increasing adoption of sustainable agricultural practices and growing consumer awareness about organic products. The United States Department of Agriculture’s organic transition initiatives, along with comprehensive support programs for farmers, are expected to further boost the organic fertilizer market in the coming years.
North America Organic Fertilizer Market in Mexico
Mexico has established itself as a significant player in the organic fertilizer market, with a projected growth rate of approximately 12% from 2024 to 2029. The country’s prominence in organic agriculture is particularly evident in its position as one of the world’s top organic food producers and the largest exporter of organic coffee. Meal-based fertilizers, particularly bone meal and blood meal, dominate the Mexican organic fertilizers landscape, showcasing the country’s preference for high-nutrient organic inputs. The Mexican agricultural sector benefits from organizations like the Asociación Nacional de Empresas Comercializadoras de Productores del Campo, which promotes agroecological farming approaches. The country’s organic farming practices are particularly concentrated in states like Chiapas, Oaxaca, Michoacán, Chihuahua, and Guerrero, which form the backbone of organic agricultural production. The government’s support through research and development initiatives, combined with financial assistance programs, has created a favorable environment for organic fertilizer adoption. Mexico’s commitment to sustainable agriculture and eco-friendly farming practices continues to drive market expansion.
North America Organic Fertilizer Market in Canada
Canada’s organic fertilizer market demonstrates strong potential, supported by the country’s commitment to sustainable agriculture and growing organic sector. The market is characterized by a strong preference for manure-based natural fertilizers, particularly in row crop cultivation. The Canadian government’s proactive approach through initiatives like the Organic Development Fund and partnerships with organizations like the Organic Federation of Canada has created a robust framework for market growth. The country’s organic industry benefits from well-established certification standards and regulatory oversight, ensuring product quality and safety. Canadian farmers are increasingly adopting organic farming practices, driven by rising consumer demand for organic products and the government’s support for sustainable agriculture. The market is further strengthened by ongoing investments in research and development, focusing on improving bio fertilizers efficiency and application methods. Despite domestic production increases, the demand for organic products continues to outpace supply, creating opportunities for market expansion.
North America Organic Fertilizer Market in Other Countries
The organic fertilizer market in other North American countries, including various Caribbean and Central American nations, demonstrates unique characteristics and growth patterns. These markets are primarily driven by the cultivation of specialty crops, particularly in the organic coffee, sugar, cocoa, and spice sectors. The agricultural practices in these regions often emphasize traditional and sustainable farming methods, which naturally align with natural fertilizers usage. Local governments are increasingly recognizing the importance of organic agriculture and are developing supportive policies and frameworks. The market in these regions benefits from growing awareness about sustainable farming practices and increasing demand for organic products in international markets. While these markets may be smaller in scale compared to the major North American countries, they play a crucial role in the region’s organic agricultural diversity and contribute to the overall growth of the organic fertilizer market.
North America Organic Fertilizer Industry Overview
Top Companies in North America Organic Fertilizer Market
The organic fertilizers market in North America is characterized by companies focusing on sustainable manufacturing practices and environmental stewardship. Companies are increasingly investing in solar-powered manufacturing facilities and implementing zero-waste production processes to minimize their environmental footprint. Product innovation is centered around developing specialized formulations for specific crop types and soil conditions, while operational agility is demonstrated through the integration of bio-preferred packaging and efficient distribution networks. Strategic moves in the industry primarily revolve around facility expansions and production capacity enhancements, with companies establishing new manufacturing units and distribution centers across different regions. Many players are also investing in research and development to improve product efficacy and develop new organic fertilizers variants, while simultaneously working on strengthening their supply chain relationships with organic raw material suppliers.
Fragmented Market with Strong Regional Players
The North American organic fertilizers market exhibits a fragmented structure with a mix of established regional players and specialized manufacturers. The market is predominantly characterized by local and regional players who have built strong distribution networks and customer relationships in their respective territories. While large agricultural input companies maintain a presence in the market, specialized organic fertilizer manufacturers with deep expertise in composting and organic waste recycling hold significant market positions. The industry structure allows for healthy competition while maintaining sufficient differentiation through specialized product offerings and service capabilities.
The market shows limited consolidation activity, with companies primarily focusing on organic growth rather than acquisitions. Most players are family-owned or privately held businesses that have developed their expertise over decades of operation in specific regional markets. The competitive dynamics are shaped by companies’ ability to secure reliable sources of organic raw materials and maintain consistent product quality while meeting increasing demand. Market entry barriers are moderate, primarily related to establishing efficient composting operations and meeting regulatory requirements for organic certification.
Innovation and Sustainability Drive Future Success
Success in the organic fertilizer market increasingly depends on companies’ ability to demonstrate environmental stewardship and product effectiveness. Future market leaders will need to invest in sustainable manufacturing processes, develop innovative product formulations, and build strong relationships with organic farmers and distributors. Companies must also focus on vertical integration to secure reliable sources of organic raw materials and maintain quality control throughout the production process. The ability to provide technical support and education to farmers transitioning to organic practices will become increasingly important as the organic farming sector continues to grow.
Market participants need to consider the growing influence of sustainability-focused consumers and regulatory requirements in shaping product development and manufacturing processes. Companies must balance the need for scale economies with maintaining product quality and organic certification standards. Success will also depend on developing efficient logistics networks to manage the transportation and storage of organic materials while maintaining product efficacy. The ability to adapt to changing weather patterns and climate conditions that affect organic raw material availability will become increasingly critical for maintaining market position. Building strong relationships with research institutions and agricultural extension services will help companies stay ahead of emerging trends and technical innovations in organic farming. Additionally, understanding organic fertilizer prices and their impact on market dynamics will be crucial for strategic planning.
North America Organic Fertilizer Market Leaders
-
- California Organic Fertilizers Inc.
- Cedar Grove Composting Inc.
- E.B.Stone & Sons Inc.
- Suståne Natural Fertilizer Inc.
- The Espoma Company
- *Disclaimer: Major Players sorted in no particular order
North America Organic Fertilizer Market News
- August 2021: Cedar Grove Composting expanded its production facility for bulk and yard waste in Kenmore, United States.
- October 2018: The Espoma Company expanded its new 12,500 sq. ft headquarters in Millville. This expansion in the production facility helped the company in the large-scale manufacture of organic fertilizers. The Espoma Company is one of the largest manufacturers and marketers of organic lawn and garden fertilizers in the United States.
Free With This Report
Along with the report, We also offer a comprehensive and exhaustive data pack on Areas under organic cultivation, one of the key trends that affect the market size of agricultural biologicals. This data pack also includes areas under cultivation by crop types, such as Row Crops (Cereals, Pulses, and Oilseeds), Horticultural Crops (Fruits and Vegetables), and Cash Crops in North America, Europe, Asia-Pacific, South America and Africa.
North America Organic Fertilizer Market Report – Table of Contents
1. EXECUTIVE SUMMARY & KEY FINDINGS
2. REPORT OFFERS
3. INTRODUCTION
- 3.1 Study Assumptions & Market Definition
- 3.2 Scope of the Study
- 3.3 Research Methodology
4. KEY INDUSTRY TRENDS
- 4.1 Area Under Organic Cultivation
- 4.2 Per Capita Spending On Organic Products
- 4.3 Regulatory Framework
- 4.3.1 Canada
- 4.3.2 Mexico
- 4.3.3 United States
- 4.4 Value Chain & Distribution Channel Analysis
5. MARKET SEGMENTATION (includes market size in Value in USD and Volume, Forecasts up to 2030 and analysis of growth prospects)
- 5.1 Form
- 5.1.1 Manure
- 5.1.2 Meal Based Fertilizers
- 5.1.3 Oilcakes
- 5.1.4 Other Organic Fertilizer
- 5.2 Crop Type
- 5.2.1 Cash Crops
- 5.2.2 Horticultural Crops
- 5.2.3 Row Crops
- 5.3 Country
- 5.3.1 Canada
- 5.3.2 Mexico
- 5.3.3 United States
- 5.3.4 Rest of North America
6. COMPETITIVE LANDSCAPE
- 6.1 Key Strategic Moves
- 6.2 Market Share Analysis
- 6.3 Company Landscape
- 6.4 Company Profiles (includes Global Level Overview, Market Level Overview, Core Business Segments, Financials, Headcount, Key Information, Market Rank, Market Share, Products and Services, and Analysis of Recent Developments).
- 6.4.1 BioFert Manufacturing Inc.
- 6.4.2 California Organic Fertilizers Inc.
- 6.4.3 Cascade Agronomics LLC
- 6.4.4 Cedar Grove Composting Inc.
- 6.4.5 E.B.Stone & Sons Inc.
- 6.4.6 Morgan Composting Inc.
- 6.4.7 Suståne Natural Fertilizer Inc.
- 6.4.8 The Espoma Company
- 6.4.9 The Rich Lawn Company LLC
- 6.4.10 Walts Organic Fertilizers Co.
7. KEY STRATEGIC QUESTIONS FOR AGRICULTURAL BIOLOGICALS CEOS
8. APPENDIX
- 8.1 Global Overview
- 8.1.1 Overview
- 8.1.2 Porter’s Five Forces Framework
- 8.1.3 Global Value Chain Analysis
- 8.1.4 Market Dynamics (DROs)
- 8.2 Sources & References
- 8.3 List of Tables & Figures
- 8.4 Primary Insights
- 8.5 Data Pack
- 8.6 Glossary of Terms
List of Tables & Figures
- Figure 1:
- AREA UNDER ORGANIC CULTIVATION IN HECTARES, NORTH AMERICA, 2017 – 2022
- Figure 2:
- PER CAPITA SPENDING ON ORGANIC PRODUCTS IN USD, NORTH AMERICA, 2017 – 2022
- Figure 3:
- NORTH AMERICA ORGANIC FERTILIZER MARKET, VOLUME, METRIC TON, 2017 – 2029
- Figure 4:
- NORTH AMERICA ORGANIC FERTILIZER MARKET, VALUE, USD, 2017 – 2029
- Figure 5:
- ORGANIC FERTILIZER CONSUMPTION IN METRIC TON, NORTH AMERICA, 2017 – 2029
- Figure 6:
- ORGANIC FERTILIZER CONSUMPTION IN USD, NORTH AMERICA, 2017 – 2029
- Figure 7:
- ORGANIC FERTILIZER CONSUMPTION VOLUME BY FORM IN %, NORTH AMERICA, 2017 VS 2023 VS 2029
- Figure 8:
- ORGANIC FERTILIZER CONSUMPTION VALUE BY FORM IN %, NORTH AMERICA, 2017 VS 2023 VS 2029
- Figure 9:
- MANURE CONSUMPTION IN METRIC TON, NORTH AMERICA, 2017 – 2029
- Figure 10:
- MANURE CONSUMPTION IN USD, NORTH AMERICA, 2017 – 2029
- Figure 11:
- MANURE CONSUMPTION VALUE BY CROP TYPE IN %, NORTH AMERICA, 2022 VS 2029
- Figure 12:
- MEAL BASED FERTILIZERS CONSUMPTION IN METRIC TON, NORTH AMERICA, 2017 – 2029
- Figure 13:
- MEAL BASED FERTILIZERS CONSUMPTION IN USD, NORTH AMERICA, 2017 – 2029
- Figure 14:
- MEAL BASED FERTILIZERS CONSUMPTION VALUE BY CROP TYPE IN %, NORTH AMERICA, 2022 VS 2029
- Figure 15:
- OILCAKES CONSUMPTION IN METRIC TON, NORTH AMERICA, 2017 – 2029
- Figure 16:
- OILCAKES CONSUMPTION IN USD, NORTH AMERICA, 2017 – 2029
- Figure 17:
- OILCAKES CONSUMPTION VALUE BY CROP TYPE IN %, NORTH AMERICA, 2022 VS 2029
- Figure 18:
- OTHER ORGANIC FERTILIZER CONSUMPTION IN METRIC TON, NORTH AMERICA, 2017 – 2029
- Figure 19:
- OTHER ORGANIC FERTILIZER CONSUMPTION IN USD, NORTH AMERICA, 2017 – 2029
- Figure 20:
- OTHER ORGANIC FERTILIZER CONSUMPTION VALUE BY CROP TYPE IN %, NORTH AMERICA, 2022 VS 2029
- Figure 21:
- ORGANIC FERTILIZER CONSUMPTION IN METRIC TON, NORTH AMERICA, 2017 – 2029
- Figure 22:
- ORGANIC FERTILIZER CONSUMPTION IN USD, NORTH AMERICA, 2017 – 2029
- Figure 23:
- ORGANIC FERTILIZER CONSUMPTION VOLUME BY CROP TYPE IN %, NORTH AMERICA, 2017 VS 2023 VS 2029
- Figure 24:
- ORGANIC FERTILIZER CONSUMPTION VALUE BY CROP TYPE IN %, NORTH AMERICA, 2017 VS 2023 VS 2029
- Figure 25:
- ORGANIC FERTILIZER CONSUMPTION BY CASH CROPS IN METRIC TON, NORTH AMERICA, 2017 – 2029
- Figure 26:
- ORGANIC FERTILIZER CONSUMPTION BY CASH CROPS IN USD, NORTH AMERICA, 2017 – 2029
- Figure 27:
- ORGANIC FERTILIZER CONSUMPTION VALUE BY FORM IN %, NORTH AMERICA, 2022 VS 2029
- Figure 28:
- ORGANIC FERTILIZER CONSUMPTION BY HORTICULTURAL CROPS IN METRIC TON, NORTH AMERICA, 2017 – 2029
- Figure 29:
- ORGANIC FERTILIZER CONSUMPTION BY HORTICULTURAL CROPS IN USD, NORTH AMERICA, 2017 – 2029
- Figure 30:
- ORGANIC FERTILIZER CONSUMPTION VALUE BY FORM IN %, NORTH AMERICA, 2022 VS 2029
- Figure 31:
- ORGANIC FERTILIZER CONSUMPTION BY ROW CROPS IN METRIC TON, NORTH AMERICA, 2017 – 2029
- Figure 32:
- ORGANIC FERTILIZER CONSUMPTION BY ROW CROPS IN USD, NORTH AMERICA, 2017 – 2029
- Figure 33:
- ORGANIC FERTILIZER CONSUMPTION VALUE BY FORM IN %, NORTH AMERICA, 2022 VS 2029
- Figure 34:
- ORGANIC FERTILIZER CONSUMPTION IN METRIC TON, NORTH AMERICA, 2017 – 2029
- Figure 35:
- ORGANIC FERTILIZER CONSUMPTION IN USD, NORTH AMERICA, 2017 – 2029
- Figure 36:
- ORGANIC FERTILIZER CONSUMPTION VOLUME BY COUNTRY IN %, NORTH AMERICA, 2017 VS 2023 VS 2029
- Figure 37:
- ORGANIC FERTILIZER CONSUMPTION VALUE BY COUNTRY IN %, NORTH AMERICA, 2017 VS 2023 VS 2029
- Figure 38:
- ORGANIC FERTILIZER CONSUMPTION IN METRIC TON, CANADA, 2017 – 2029
- Figure 39:
- ORGANIC FERTILIZER CONSUMPTION IN USD, CANADA, 2017 – 2029
- Figure 40:
- ORGANIC FERTILIZER CONSUMPTION VALUE BY FORM IN %, CANADA, 2022 VS 2029
- Figure 41:
- ORGANIC FERTILIZER CONSUMPTION IN METRIC TON, MEXICO, 2017 – 2029
- Figure 42:
- ORGANIC FERTILIZER CONSUMPTION IN USD, MEXICO, 2017 – 2029
- Figure 43:
- ORGANIC FERTILIZER CONSUMPTION VALUE BY FORM IN %, MEXICO, 2022 VS 2029
- Figure 44:
- ORGANIC FERTILIZER CONSUMPTION IN METRIC TON, UNITED STATES, 2017 – 2029
- Figure 45:
- ORGANIC FERTILIZER CONSUMPTION IN USD, UNITED STATES, 2017 – 2029
- Figure 46:
- ORGANIC FERTILIZER CONSUMPTION VALUE BY FORM IN %, UNITED STATES, 2022 VS 2029
- Figure 47:
- ORGANIC FERTILIZER CONSUMPTION IN METRIC TON, REST OF NORTH AMERICA, 2017 – 2029
- Figure 48:
- ORGANIC FERTILIZER CONSUMPTION IN USD, REST OF NORTH AMERICA, 2017 – 2029
- Figure 49:
- ORGANIC FERTILIZER CONSUMPTION VALUE BY FORM IN %, REST OF NORTH AMERICA, 2022 VS 2029
- Figure 50:
- NORTH AMERICA ORGANIC FERTILIZER MARKET, MOST ACTIVE COMPANIES, BY NUMBER OF STRATEGIC MOVES, 2017-2022
- Figure 51:
- NORTH AMERICA ORGANIC FERTILIZER MARKET, MOST ADOPTED STRATEGIES, 2017-2022
- Figure 52:
- NORTH AMERICA ORGANIC FERTILIZER MARKET SHARE(%), BY MAJOR PLAYERS
North America Organic Fertilizer Industry Segmentation
Manure, Meal Based Fertilizers, Oilcakes are covered as segments by Form. Cash Crops, Horticultural Crops, Row Crops are covered as segments by Crop Type. Canada, Mexico, United States are covered as segments by Country.
| Form | Manure |
| Meal Based Fertilizers | |
| Oilcakes | |
| Other Organic Fertilizer | |
| Crop Type | Cash Crops |
| Horticultural Crops | |
| Row Crops | |
| Country | Canada |
| Mexico | |
| United States | |
| Rest of North America |
Market Definition
- AVERAGE DOSAGE RATE – The average application rate is the average volume of organic fertilizers applied per hectare of farmland in the respective region/country.
- CROP TYPE – Crop type includes Row crops (Cereals, Pulses, Oilseeds), Horticultural Crops (Fruits and vegetables) and Cash Crops (Plantation Crops, Fibre Crops and Other Industrial Crops)
- FUNCTION – The crop nutrition function of agricultural biological consists of various products that provide essential plant nutrients and enhance soil quality.
- TYPE – Organic fertilizers are applied to provide essential crop nutrients and enhance the soil quality.
| Keyword | Definition |
|---|---|
| Cash Crops | Cash crops are non-consumable crops sold as a whole or part of the crop to manufacture end-products to make a profit. |
| Integrated Pest Management (IPM) | IPM is an environment-friendly and sustainable approach to control pests in various crops. It involves a combination of methods, including biological controls, cultural practices, and selective use of pesticides. |
| Bacterial biocontrol agents | Bacteria used to control pests and diseases in crops. They work by producing toxins harmful to the target pests or competing with them for nutrients and space in the growing environment. Some examples of commonly used bacterial biocontrol agents include Bacillus thuringiensis (Bt), Pseudomonas fluorescens, and Streptomyces spp. |
| Plant Protection Product (PPP) | A plant protection product is a formulation applied to crops to protect from pests, such as weeds, diseases, or insects. They contain one or more active substances with other co-formulants such as solvents, carriers, inert material, wetting agents or adjuvants formulated to give optimum product efficacy. |
| Pathogen | A pathogen is an organism causing disease to its host, with the severity of the disease symptoms. |
| Parasitoids | Parasitoids are insects that lay their eggs on or within the host insect, with their larvae feeding on the host insect. In agriculture, parasitoids can be used as a form of biological pest control, as they help to control pest damage to crops and decrease the need for chemical pesticides. |
| Entomopathogenic Nematodes (EPN) | Entomopathogenic nematodes are parasitic roundworms that infect and kill pests by releasing bacteria from their gut. Entomopathogenic nematodes are a form of biocontrol agents used in agriculture. |
| Vesicular-arbuscular mycorrhiza (VAM) | VAM fungi are mycorrhizal species of fungus. They live in the roots of different higher-order plants. They develop a symbiotic relationship with the plants in the roots of these plants. |
| Fungal biocontrol agents | Fungal biocontrol agents are the beneficial fungi that control plant pests and diseases. They are an alternative to chemical pesticides. They infect and kill the pests or compete with pathogenic fungi for nutrients and space. |
| Biofertilizers | Biofertilizers contain beneficial microorganisms that enhance soil fertility and promote plant growth. |
| Biopesticides | Biopesticides are natural/bio-based compounds used to manage agricultural pests using specific biological effects. |
| Predators | Predators in agriculture are the organisms that feed on pests and help control pest damage to the crops. Some common predator species used in agriculture include ladybugs, lacewings, and predatory mites. |
| Biocontrol agents | Biocontrol agents are living organisms used to control pests and diseases in agriculture. They are alternatives to chemical pesticides and are known for their lesser impact on the environment and human health. |
| Organic Fertilizers | Organic fertilizer is composed of animal or vegetable matter used alone or in combination with one or more non-synthetically derived elements or compounds used for soil fertility and plant growth. |
| Protein hydrolysates (PHs) | Protein hydrolysate-based biostimulants contain free amino acids, oligopeptides, and polypeptides produced by enzymatic or chemical hydrolysis of proteins, primarily from vegetal or animal sources. |
| Biostimulants/Plant Growth Regulators (PGR) | Biostimulants/Plant Growth Regulators (PGR) are substances derived from natural resources to enhance plant growth and health by stimulating plant processes (metabolism). |
| Soil Amendments | Soil Amendments are substances applied to soil that improve soil health, such as soil fertility and soil structure. |
| Seaweed Extract | Seaweed extracts are rich in micro and macronutrients, proteins, polysaccharides, polyphenols, phytohormones, and osmolytes. These substances boost seed germination and crop establishment, total plant growth and productivity. |
| Compounds related to biocontrol and/or promoting growth (CRBPG) | Compounds related to biocontrol or promoting growth (CRBPG) are the ability of a bacteria to produce compounds for phytopathogen biocontrol and plant growth promotion. |
| Symbiotic Nitrogen-Fixing Bacteria | Symbiotic nitrogen-fixing bacteria such as Rhizobium obtain food and shelter from the host, and in return, they help by providing fixed nitrogen to the plants. |
| Nitrogen Fixation | Nitrogen fixation is a chemical process in soil which converts molecular nitrogen into ammonia or related nitrogenous compounds. |
| ARS (Agricultural Research Service) | ARS is the U.S. Department of Agriculture’s chief scientific in-house research agency. It aims to find solutions to agricultural problems faced by the farmers in the country. |
| Phytosanitary Regulations | Phytosanitary regulations imposed by the respective government bodies check or prohibit the importation and marketing of certain insects, plant species, or products of these plants to prevent the introduction or spread of new plant pests or pathogens. |
| Ectomycorrhizae (ECM) | Ectomycorrhiza (ECM) is a symbiotic interaction of fungi with the feeder roots of higher plants in which both the plant and the fungi benefit through the association for survival. |
Research Methodology
- Step-1: Identify Key Variables: In order to build a robust forecasting methodology, the variables and factors identified in Step-1 are tested against available historical market numbers. Through an iterative process, the variables required for market forecast are set and the model is built on the basis of these variables.
- Step-2: Build a Market Model: Market-size estimations for the forecast years are in nominal terms. Inflation is not a part of the pricing, and the average selling price (ASP) is kept constant throughout the forecast period.
- Step-3: Validate and Finalize: In this important step, all market numbers, variables and analyst calls are validated through an extensive network of primary research experts from the market studied. The respondents are selected across levels and functions to generate a holistic picture of the market studied.
- Step-4: Research Outputs: Syndicated Reports, Custom Consulting Assignments, Databases & Subscription Platforms.
North America Organic Fertilizer Market Research FAQs
The North America Organic Fertilizer Market size is expected to reach USD 957.19 million in 2025 and grow at a CAGR of 11.77% to reach USD 1.67 billion by 2030.
In 2025, the North America Organic Fertilizer Market size is expected to reach USD 957.19 million.
California Organic Fertilizers Inc., Cedar Grove Composting Inc., E.B.Stone & Sons Inc., Suståne Natural Fertilizer Inc. and The Espoma Company are the major companies operating in the North America Organic Fertilizer Market.
In the North America Organic Fertilizer Market, the Meal Based Fertilizers segment accounts for the largest share by form.
In 2025, United States accounts for the largest share by country in the North America Organic Fertilizer Market.
In 2025, the North America Organic Fertilizer Market size was estimated at 957.19 million. The report covers the North America Organic Fertilizer Market historical market size for years: 2017, 2018, 2019, 2020, 2021, 2022, 2023 and 2024. The report also forecasts the North America Organic Fertilizer Market size for years: 2025, 2026, 2027, 2028, 2029 and 2030.