
Milk Protein Market Size

Key Players
Milk Protein Market Analysis
The Milk Protein Market size is estimated at 1.38 billion USD in 2025, and is expected to reach 1.8 billion USD by 2030, growing at a CAGR of 5.52% during the forecast period (2025-2030).
1.38 Billion
Market Size in 2025 (USD)
1.8 Billion
Market Size in 2030 (USD)
4.11 %
CAGR (2017-2024)
5.52 %
CAGR (2025-2030)
Largest Market by Form
52.92 %
value share, Isolates, 2024
The superior qualities and functionalities of MPIs, such as high protein content, lower carbs, and lower lactose content, make them the leading protein ingredient in the market.
Largest Market by End User
52.85 %
value share, Food and Beverages, 2024
Milk protein has become increasingly popular in the food and beverage segment due to its nutritious value and appealing appearance. Milk proteins are widely used in pastries, drinks, and baked items.
Fastest Growing Market by Form
5.88 %
Projected CAGR, Hydrolyzed, 2025-2030
Its high demand in the personal care sector hiked after research confirmed its benefits, such as reducing allergic infections on the skin is driving the demand.
Fastest Growing Market by End User
6.01 %
Projected CAGR, Supplements, 2025-2030
The rising rates of gym memberships and recommendations for protein consumption by trainers are likely to propel the growth of the segment during the forecast period.
Leading Market Player
15.43 %
market share, Royal FrieslandCampina NV,
Royal Friesland Campina NV gained a competitive edge over other market players owing to its extensive product portfolio and strategic innovations.
With 85.67% of milk protein demand in the bakery, snacks, and beverage industries, food and beverages segment has led the market
- By application, the F&B sector retained the top position in the market throughout the review period. By volume, 85.67% of milk protein demand in the F&B segment was driven by the bakery, snacks, and beverage industries in 2022. Milk proteins are gaining popularity in low-acid beverages due to their greater solubility and heat stability. Similarly, milk proteins’ high efficacy in egg replacement boosted its demand in the bakery industry, especially in countries where avian flu is a budding concern. Hence, the use of milk proteins in the F&B segment is anticipated to register a CAGR of 4.55%, by volume, during the forecast period.
- On the other hand, the supplements sector also recorded a significant global demand. This was led by the growing demand for the sport and performance nutrition and baby food and infant formula industries, which accounted for shares of 33% and 66%, by volume, respectively, in the supplements segment. Sports and performance nutrition is projected to be the fastest-growing among all supplements sub-segments, recording a CAGR of 6.08% during the forecast period. Milk protein is an excellent alternative for bodybuilders due to its ability to offer a whey-to-casein ratio of 20:80. More than 75% of Americans take dietary supplements every year; with 79% of female adults and 74% of male adults claiming to consume at least one form of supplements with their diet.
- In June 2020, the FDA decided to allow the inclusion of milk protein concentrate (MPC), milk protein isolate (MPI), and a few additional additives in products branded as “high protein milk,” which is further expected to propel the market segment during the forecast period.

Increasing population with rising prevalence of obesity and other health concerns, Asia-Pacific witnessed the highest market for milk protein
- Asia-Pacific, particularly China (with a 33.8% share in the regional market in 2022), is the leading market for milk protein, aided by constant innovations targeting distinct end-user segments. Increases in the prevalence of obesity (roughly 27% of the population, more than half a billion people in 2020) and fitness enthusiasts choosing high-protein foods have positioned China as the market leader. The dairy industry has recorded immense growth globally, driving milk protein production. These proteins have immense applications in the bakery sub-segment in the food and beverages segment, followed by the supplements segment.
- Europe holds the second-largest market share and has been attracting foreign investments in line with harmonization achieved by Turkish and EU Food Laws. Other regions hold enormous development potential, prompting multinational businesses to spend heavily in the milk protein market in Africa, South America, and the Middle East. Dairy ingredient maker Darigold, a major brand that offers milk protein concentrates, opened an office in Dubai in 2019 for improved service integration with customers in the Middle East and Africa.
- The Middle East region is projected to be the fastest-growing in the market, with a CAGR of 6.25% by value during the forecast period 2023-2029. Due to the growing awareness of its nutritional value, raw material manufacturers are opening sales offices and selling products in the Middle Eastern market. In 2021, around 48.2% of people across Saudi Arabia practiced physical and sporting activities at least 30 minutes a week. The protein consumption in the supplements segment accounted for a volume of 8,234.4 ton in 2022 in Saudi Arabia.
Global Milk Protein Market Trends
Rising health awareness and growing demand from millennials are driving the market
- Rising health awareness and a surge in demand from millennials are driving the sports nutrition segment. The segment is witnessing an upswing, with consumers increasingly seeking protein-enriched beverages and dietary supplements, citing benefits like muscle maintenance and growth. For instance, the 2023 CRN Consumer Survey on Dietary Supplements reveals that 74% of US adults consume dietary supplements, with 55% identified as “regular users”.
- Sports drinks, traditionally marketed for their electrolyte-replenishing properties during intense physical activities, have evolved to emphasize benefits such as increased carbohydrates, salts, and enhanced performance during workouts. This evolution aligns with the shift toward active and healthier lifestyles. The sports nutrition segment has seen a boost from growing participation in sports among middle-aged and elderly populations. For example, in 2022, the rate of regular sports participation among Asian youth aged 6 to 12 years surged to 42%, up from 35% in 2019.
- North America stands at the forefront of the sports nutrition segment, driven by a rising athletic trend, health concerns, and dietary habits. The market is expected to benefit from the ongoing trend of flavor innovations that boast health advantages. Meanwhile, Europe is emerging as a significant player, with key markets like the United Kingdom, Germany, Spain, and France commanding a major share of the market. In 2022, statistics revealed that 38% of adults in the European Union engaged in sports or exercise at least once a week, with 6% committing to it five times weekly.

Milk continues to contribute as a major animal protein source
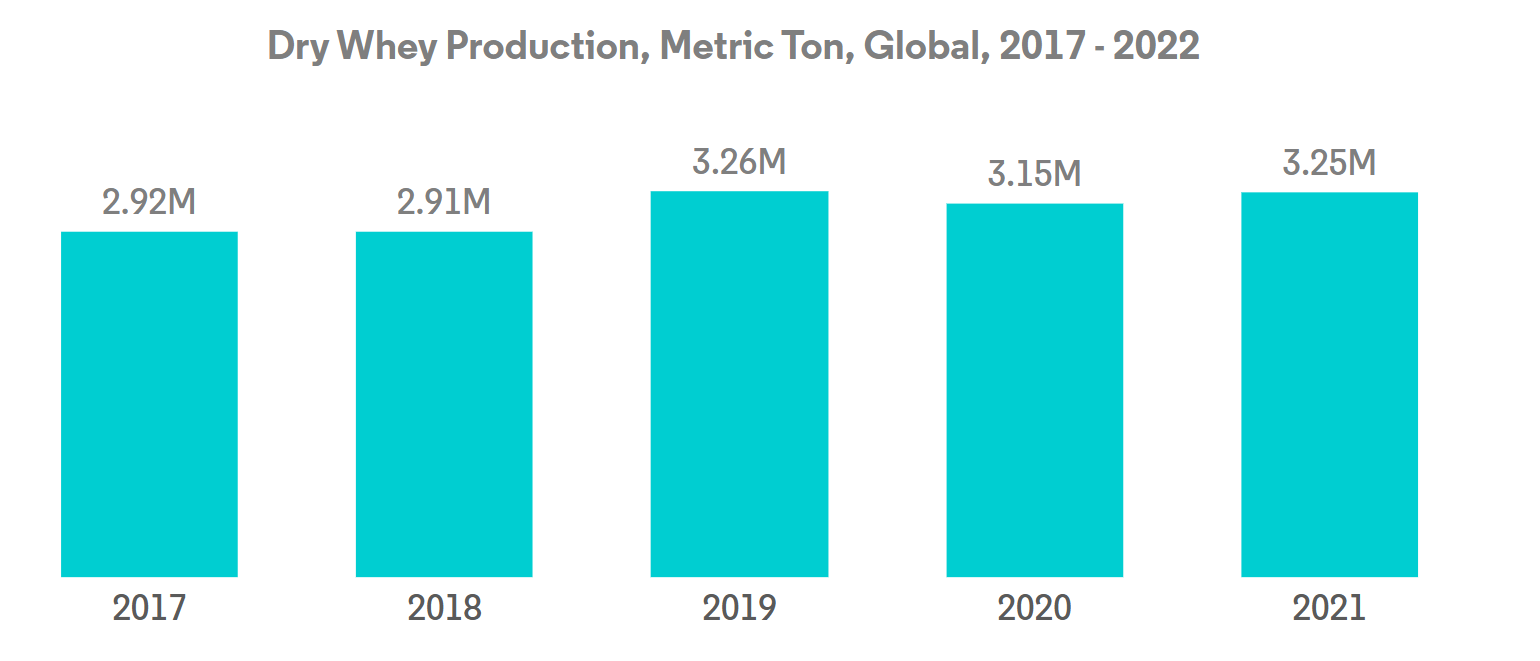
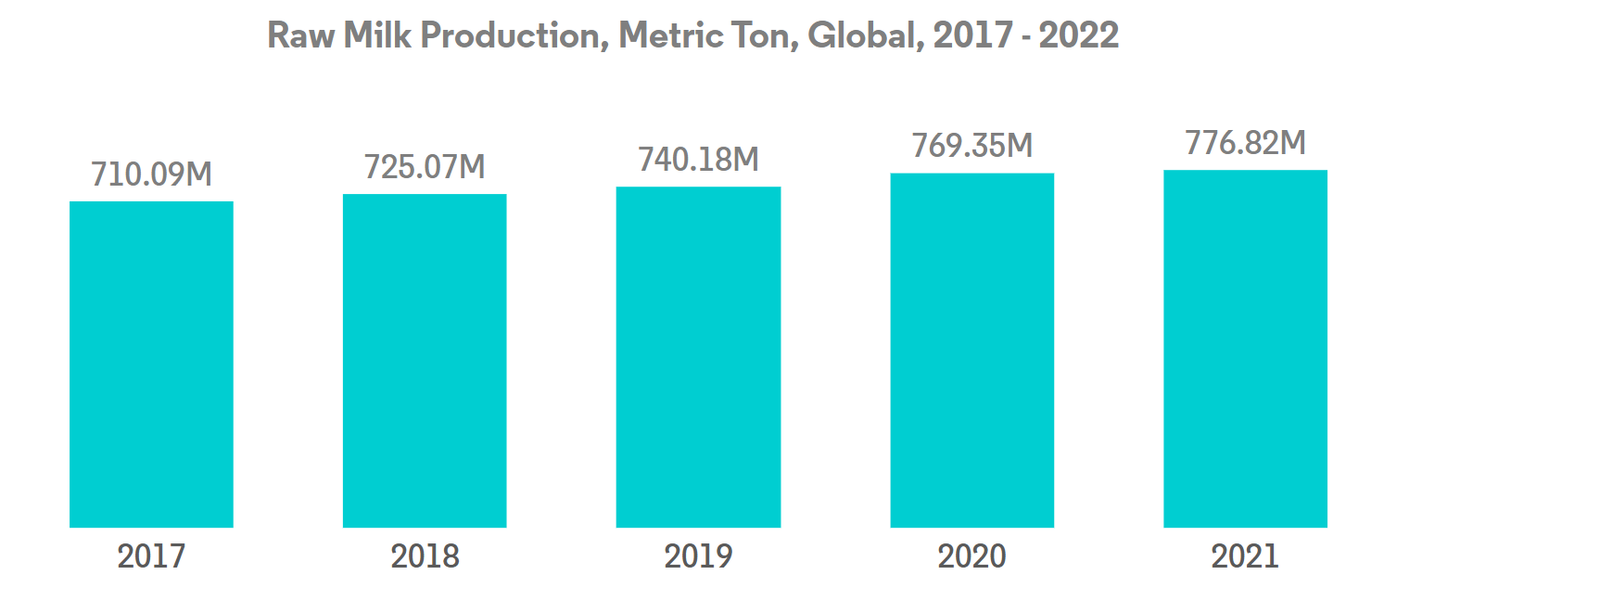
- Milk is a key source of financial revenue for small-scale farmers and offers relatively quick returns. This development is mostly due to an increase in the number of milk-producing animals and a tangible expansion in yield figures rather than an increase in production per head. Global milk production increased by more than 59% in the previous three decades, from 530 million tons in 1988 to 843 million tons in 2018, and global milk production in 2022 was projected to reach 937 million tons, up 1.0% from 2021. According to production data from the Food and Agriculture Organization Corporate Statistical Database (FAOSTAT), India is the highest milk producer in the world. India contributed 24% of global milk production from 2021 to 2022.
- Asia, led by India and Pakistan’s efficiency in milk collection and China’s burgeoning large-scale farms, is poised to be the linchpin of global milk production. While North America, Central America, and the Caribbean saw moderate growth in milk output in 2022, largely driven by enhanced yields, Europe, South America, and Oceania faced projections of declining production. This decline is attributed to diminishing dairy cattle numbers, a rising shortage of skilled labor, and subpar pasture quality.
- France experienced a notable dip in milk supply in the European Union in January 2021, down over 3% from the same month in 2020, settling at just over 2 billion liters. This translated to a production drop of more than 70 million liters compared to January 2020. The decline was primarily linked to harsh early 2021 weather, alongside elevated feed prices and substandard silage quality.

OTHER KEY INDUSTRY TRENDS COVERED IN THE REPORT
- Rising trend of clean-label baby food and escalating strategic investments are driving the market globally
- Healthy trends in beverages are impacting market growth
- A rise in the demand for single-serve packets may augment production
- Dairy alternatives to witness significant growth
- Meat protein alternatives are revolutionizing the meat segment
- Healthy snacking preferences with growth in online platforms are supporting market growth
- Natural ingredients, coupled with product specificity, are largely driving the segmental sales
- Europe is the leading market with a high demand for bread and biscuits
- Growing preference for convenient breakfast options may augment the market
- Increase in at-home consumption and demand for healthy confectionery products
- Growing nutritional concerns for aging populations drive the demand for medical nutrition products globally
- Ready-to-cook and frozen foods have witnessed a surge in sales
- The increasing demand for compound feed containing functional ingredients is affecting sales within this segment
- Consumption and usage of animal protein in cosmetics and nutricosmetics are supporting the market’s growth globally
Milk Protein Industry Overview
The Milk Protein Market is moderately consolidated, with the top five companies occupying 41.38%. The major players in this market are Agrial Enterprise, Fonterra Co-operative Group Limited, Glanbia PLC, Kerry Group PLC and Royal FrieslandCampina NV (sorted alphabetically).
Milk Protein Market Leaders
- Agrial Enterprise
- Fonterra Co-operative Group Limited
- Glanbia PLC
- Kerry Group PLC
- Royal FrieslandCampina NV

Other important companies include Groupe LACTALIS, Morinaga Milk Industry Co., Ltd., Olam International Limited.
*Disclaimer: Major Players sorted in alphabetical order.
Milk Protein Market News
- November 2021: Lactalis Ingredients launched new high-protein product concepts using Pronativ® Native Micellar Casein and Pronativ® Native Whey Protein. Some of the derived concepts are high-protein shakes and high-protein pudding.
- August 2021: Lactalis India launched a protein-packed yogurt drink called Lactel Turbo Yoghurt Drink. The drink is available in mango and strawberry flavors.
- February 2021: FrieslandCampina Ingredients partnered with Cayuga Milk Ingredients for the production of its Refit milk proteins, MPI 90 and MPC 85.
Milk Protein Market Report – Table of Contents
1. EXECUTIVE SUMMARY & KEY FINDINGS
2. INTRODUCTION
- 2.1 Study Assumptions & Market Definition
- 2.2 Scope of the Study
- 2.3 Research Methodology
3. KEY INDUSTRY TRENDS
- 3.1 End User Market Volume
- 3.1.1 Baby Food and Infant Formula
- 3.1.2 Bakery
- 3.1.3 Beverages
- 3.1.4 Breakfast Cereals
- 3.1.5 Condiments/Sauces
- 3.1.6 Confectionery
- 3.1.7 Dairy and Dairy Alternative Products
- 3.1.8 Elderly Nutrition and Medical Nutrition
- 3.1.9 Meat/Poultry/Seafood and Meat Alternative Products
- 3.1.10 RTE/RTC Food Products
- 3.1.11 Snacks
- 3.1.12 Sport/Performance Nutrition
- 3.1.13 Animal Feed
- 3.1.14 Personal Care and Cosmetics
- 3.2 Protein Consumption Trends
- 3.2.1 Animal
- 3.3 Production Trends
- 3.3.1 Animal
- 3.4 Regulatory Framework
- 3.4.1 Australia
- 3.4.2 Canada
- 3.4.3 China
- 3.4.4 France
- 3.4.5 Germany
- 3.4.6 India
- 3.4.7 Italy
- 3.4.8 United Kingdom
- 3.4.9 United States
- 3.5 Value Chain & Distribution Channel Analysis
4. MARKET SEGMENTATION (includes market size in Value in USD and Volume, Forecasts up to 2030 and analysis of growth prospects)
- 4.1 Form
- 4.1.1 Concentrates
- 4.1.2 Hydrolyzed
- 4.1.3 Isolates
- 4.2 End User
- 4.2.1 Animal Feed
- 4.2.2 Food and Beverages
- 4.2.2.1 By Sub End User
- 4.2.2.1.1 Bakery
- 4.2.2.1.2 Beverages
- 4.2.2.1.3 Breakfast Cereals
- 4.2.2.1.4 Condiments/Sauces
- 4.2.2.1.5 Dairy and Dairy Alternative Products
- 4.2.2.1.6 RTE/RTC Food Products
- 4.2.2.1.7 Snacks
- 4.2.3 Personal Care and Cosmetics
- 4.2.4 Supplements
- 4.2.4.1 By Sub End User
- 4.2.4.1.1 Baby Food and Infant Formula
- 4.2.4.1.2 Elderly Nutrition and Medical Nutrition
- 4.2.4.1.3 Sport/Performance Nutrition
- 4.3 Region
- 4.3.1 Africa
- 4.3.1.1 By Form
- 4.3.1.2 By End User
- 4.3.1.3 By Country
- 4.3.1.3.1 Nigeria
- 4.3.1.3.2 South Africa
- 4.3.1.3.3 Rest of Africa
- 4.3.2 Asia-Pacific
- 4.3.2.1 By Form
- 4.3.2.2 By End User
- 4.3.2.3 By Country
- 4.3.2.3.1 Australia
- 4.3.2.3.2 China
- 4.3.2.3.3 India
- 4.3.2.3.4 Indonesia
- 4.3.2.3.5 Japan
- 4.3.2.3.6 Malaysia
- 4.3.2.3.7 New Zealand
- 4.3.2.3.8 South Korea
- 4.3.2.3.9 Thailand
- 4.3.2.3.10 Vietnam
- 4.3.2.3.11 Rest of Asia-Pacific
- 4.3.3 Europe
- 4.3.3.1 By Form
- 4.3.3.2 By End User
- 4.3.3.3 By Country
- 4.3.3.3.1 Belgium
- 4.3.3.3.2 France
- 4.3.3.3.3 Germany
- 4.3.3.3.4 Italy
- 4.3.3.3.5 Netherlands
- 4.3.3.3.6 Russia
- 4.3.3.3.7 Spain
- 4.3.3.3.8 Turkey
- 4.3.3.3.9 United Kingdom
- 4.3.3.3.10 Rest of Europe
- 4.3.4 Middle East
- 4.3.4.1 By Form
- 4.3.4.2 By End User
- 4.3.4.3 By Country
- 4.3.4.3.1 Iran
- 4.3.4.3.2 Saudi Arabia
- 4.3.4.3.3 United Arab Emirates
- 4.3.4.3.4 Rest of Middle East
- 4.3.5 North America
- 4.3.5.1 By Form
- 4.3.5.2 By End User
- 4.3.5.3 By Country
- 4.3.5.3.1 Canada
- 4.3.5.3.2 Mexico
- 4.3.5.3.3 United States
- 4.3.5.3.4 Rest of North America
- 4.3.6 South America
- 4.3.6.1 By Form
- 4.3.6.2 By End User
- 4.3.6.3 By Country
- 4.3.6.3.1 Argentina
- 4.3.6.3.2 Brazil
- 4.3.6.3.3 Rest of South America
5. COMPETITIVE LANDSCAPE
- 5.1 Key Strategic Moves
- 5.2 Market Share Analysis
- 5.3 Company Landscape
- 5.4 Company Profiles (includes Global Level Overview, Market Level Overview, Core Business Segments, Financials, Headcount, Key Information, Market Rank, Market Share, Products and Services, and Analysis of Recent Developments).
- 5.4.1 Agrial Enterprise
- 5.4.2 Fonterra Co-operative Group Limited
- 5.4.3 Glanbia PLC
- 5.4.4 Groupe LACTALIS
- 5.4.5 Kerry Group PLC
- 5.4.6 Morinaga Milk Industry Co., Ltd.
- 5.4.7 Olam International Limited
- 5.4.8 Royal FrieslandCampina NV
6. KEY STRATEGIC QUESTIONS FOR PROTEIN INGREDIENTS INDUSTRY CEOS
7. APPENDIX
- 7.1 Global Overview
- 7.1.1 Overview
- 7.1.2 Porter’s Five Forces Framework
- 7.1.3 Global Value Chain Analysis
- 7.1.4 Market Dynamics (DROs)
- 7.2 Sources & References
- 7.3 List of Tables & Figures
- 7.4 Primary Insights
- 7.5 Data Pack
- 7.6 Glossary of Terms
List of Tables & Figures
- Figure 1:
- VOLUME OF BABY FOOD AND INFANT FORMULA MARKET, METRIC TON, GLOBAL, 2017 – 2029
- Figure 2:
- VOLUME OF BAKERY MARKET, METRIC TON, GLOBAL, 2017 – 2029
- Figure 3:
- VOLUME OF BEVERAGES MARKET, METRIC TON, GLOBAL, 2017 – 2029
- Figure 4:
- VOLUME OF BREAKFAST CEREALS MARKET, METRIC TON, GLOBAL, 2017 – 2029
- Figure 5:
- VOLUME OF CONDIMENTS/SAUCES MARKET, METRIC TON, GLOBAL, 2017 – 2029
- Figure 6:
- VOLUME OF CONFECTIONERY MARKET, METRIC TON, GLOBAL, 2017 – 2029
- Figure 7:
- VOLUME OF DAIRY AND DAIRY ALTERNATIVE PRODUCTS MARKET, METRIC TON, GLOBAL, 2017 – 2029
- Figure 8:
- VOLUME OF ELDERLY NUTRITION AND MEDICAL NUTRITION MARKET, METRIC TON, GLOBAL, 2017 – 2029
- Figure 9:
- VOLUME OF MEAT/POULTRY/SEAFOOD AND MEAT ALTERNATIVE PRODUCTS MARKET, METRIC TON, GLOBAL, 2017 – 2029
- Figure 10:
- VOLUME OF RTE/RTC FOOD PRODUCTS MARKET, METRIC TON, GLOBAL, 2017 – 2029
- Figure 11:
- VOLUME OF SNACKS MARKET, METRIC TON, GLOBAL, 2017 – 2029
- Figure 12:
- VOLUME OF SPORT/PERFORMANCE NUTRITION MARKET, METRIC TON, GLOBAL, 2017 – 2029
- Figure 13:
- VOLUME OF ANIMAL FEED MARKET, METRIC TON, GLOBAL, 2017 – 2029
- Figure 14:
- VOLUME OF PERSONAL CARE AND COSMETICS MARKET, METRIC TON, GLOBAL, 2017 – 2029
- Figure 15:
- AVERAGE PER CAPITA CONSUMPTION OF ANIMAL PROTEIN, GRAM PER DAY, GLOBAL, 2017 – 2029
- Figure 16:
- RAW MILK PRODUCTION, METRIC TON, GLOBAL, 2017 – 2022
- Figure 17:
- VOLUME OF MILK PROTEIN MARKET, TONNES, GLOBAL, 2017 – 2029
- Figure 18:
- VALUE OF MILK PROTEIN MARKET, USD, GLOBAL, 2017 – 2029
- Figure 19:
- VOLUME OF MILK PROTEIN MARKET BY FORM, METRIC TONNES, GLOBAL, 2017 – 2029
- Figure 20:
- VALUE OF MILK PROTEIN MARKET BY FORM, USD, GLOBAL, 2017 – 2029
- Figure 21:
- VALUE SHARE OF MILK PROTEIN MARKET BY FORM, %, GLOBAL, 2017 VS 2023 VS 2029
- Figure 22:
- VOLUME SHARE OF MILK PROTEIN MARKET BY FORM, %, GLOBAL, 2017 VS 2023 VS 2029
- Figure 23:
- VOLUME OF MILK PROTEIN MARKET, CONCENTRATES, METRIC TONNES, GLOBAL, 2017 – 2029
- Figure 24:
- VALUE OF MILK PROTEIN MARKET, CONCENTRATES, USD, GLOBAL, 2017 – 2029
- Figure 25:
- VALUE SHARE OF MILK PROTEIN MARKET BY END USER, % CONCENTRATES , GLOBAL, 2023 VS 2029
- Figure 26:
- VOLUME OF MILK PROTEIN MARKET, HYDROLYZED, METRIC TONNES, GLOBAL, 2017 – 2029
- Figure 27:
- VALUE OF MILK PROTEIN MARKET, HYDROLYZED, USD, GLOBAL, 2017 – 2029
- Figure 28:
- VALUE SHARE OF MILK PROTEIN MARKET BY END USER, % HYDROLYZED , GLOBAL, 2023 VS 2029
- Figure 29:
- VOLUME OF MILK PROTEIN MARKET, ISOLATES, METRIC TONNES, GLOBAL, 2017 – 2029
- Figure 30:
- VALUE OF MILK PROTEIN MARKET, ISOLATES, USD, GLOBAL, 2017 – 2029
- Figure 31:
- VALUE SHARE OF MILK PROTEIN MARKET BY END USER, % ISOLATES , GLOBAL, 2023 VS 2029
- Figure 32:
- VOLUME OF MILK PROTEIN MARKET BY END USER, METRIC TONNES, GLOBAL, 2017 – 2029
- Figure 33:
- VALUE OF MILK PROTEIN MARKET BY END USER, USD, GLOBAL, 2017 – 2029
- Figure 34:
- VALUE SHARE OF MILK PROTEIN MARKET BY END USER, %, GLOBAL, 2017 VS 2023 VS 2029
- Figure 35:
- VOLUME SHARE OF MILK PROTEIN MARKET BY END USER, %, GLOBAL, 2017 VS 2023 VS 2029
- Figure 36:
- VOLUME OF MILK PROTEIN MARKET, ANIMAL FEED, GLOBAL, 2017 – 2029
- Figure 37:
- VALUE OF MILK PROTEIN MARKET, ANIMAL FEED, GLOBAL, 2017 – 2029
- Figure 38:
- VALUE SHARE OF MILK PROTEIN MARKET BY FORM, % ANIMAL FEED , GLOBAL, 2023 VS 2029
- Figure 39:
- VOLUME OF MILK PROTEIN MARKET, FOOD AND BEVERAGES END USER, METRIC TONNES, GLOBAL, 2017 – 2029
- Figure 40:
- VALUE OF MILK PROTEIN MARKET, FOOD AND BEVERAGES END USER, USD, GLOBAL, 2017 – 2029
- Figure 41:
- VALUE SHARE OF MILK PROTEIN MARKET BY FOOD AND BEVERAGES END USER, %, GLOBAL, 2017 VS 2023 VS 2029
- Figure 42:
- VOLUME SHARE OF MILK PROTEIN MARKET BY FOOD AND BEVERAGES END USER, %, GLOBAL, 2017 VS 2023 VS 2029
- Figure 43:
- VOLUME OF MILK PROTEIN MARKET, BAKERY, METRIC TONNES, GLOBAL, 2017 – 2029
- Figure 44:
- VALUE OF MILK PROTEIN MARKET, BAKERY, USD, GLOBAL, 2017 – 2029
- Figure 45:
- VALUE SHARE OF MILK PROTEIN MARKET BY FORM, % BAKERY , GLOBAL, 2023 VS 2029
- Figure 46:
- VOLUME OF MILK PROTEIN MARKET, BEVERAGES, METRIC TONNES, GLOBAL, 2017 – 2029
- Figure 47:
- VALUE OF MILK PROTEIN MARKET, BEVERAGES, USD, GLOBAL, 2017 – 2029
- Figure 48:
- VALUE SHARE OF MILK PROTEIN MARKET BY FORM, % BEVERAGES , GLOBAL, 2023 VS 2029
- Figure 49:
- VOLUME OF MILK PROTEIN MARKET, BREAKFAST CEREALS, METRIC TONNES, GLOBAL, 2017 – 2029
- Figure 50:
- VALUE OF MILK PROTEIN MARKET, BREAKFAST CEREALS, USD, GLOBAL, 2017 – 2029
- Figure 51:
- VALUE SHARE OF MILK PROTEIN MARKET BY FORM, % BREAKFAST CEREALS , GLOBAL, 2023 VS 2029
- Figure 52:
- VOLUME OF MILK PROTEIN MARKET, CONDIMENTS/SAUCES, METRIC TONNES, GLOBAL, 2017 – 2029
- Figure 53:
- VALUE OF MILK PROTEIN MARKET, CONDIMENTS/SAUCES, USD, GLOBAL, 2017 – 2029
- Figure 54:
- VALUE SHARE OF MILK PROTEIN MARKET BY FORM, % CONDIMENTS/SAUCES , GLOBAL, 2023 VS 2029
- Figure 55:
- VOLUME OF MILK PROTEIN MARKET, DAIRY AND DAIRY ALTERNATIVE PRODUCTS, METRIC TONNES, GLOBAL, 2017 – 2029
- Figure 56:
- VALUE OF MILK PROTEIN MARKET, DAIRY AND DAIRY ALTERNATIVE PRODUCTS, USD, GLOBAL, 2017 – 2029
- Figure 57:
- VALUE SHARE OF MILK PROTEIN MARKET BY FORM, % DAIRY AND DAIRY ALTERNATIVE PRODUCTS , GLOBAL, 2023 VS 2029
- Figure 58:
- VOLUME OF MILK PROTEIN MARKET, RTE/RTC FOOD PRODUCTS, METRIC TONNES, GLOBAL, 2017 – 2029
- Figure 59:
- VALUE OF MILK PROTEIN MARKET, RTE/RTC FOOD PRODUCTS, USD, GLOBAL, 2017 – 2029
- Figure 60:
- VALUE SHARE OF MILK PROTEIN MARKET BY FORM, % RTE/RTC FOOD PRODUCTS , GLOBAL, 2023 VS 2029
- Figure 61:
- VOLUME OF MILK PROTEIN MARKET, SNACKS, METRIC TONNES, GLOBAL, 2017 – 2029
- Figure 62:
- VALUE OF MILK PROTEIN MARKET, SNACKS, USD, GLOBAL, 2017 – 2029
- Figure 63:
- VALUE SHARE OF MILK PROTEIN MARKET BY FORM, % SNACKS , GLOBAL, 2023 VS 2029
- Figure 64:
- VOLUME OF MILK PROTEIN MARKET, PERSONAL CARE AND COSMETICS, GLOBAL, 2017 – 2029
- Figure 65:
- VALUE OF MILK PROTEIN MARKET, PERSONAL CARE AND COSMETICS, GLOBAL, 2017 – 2029
- Figure 66:
- VALUE SHARE OF MILK PROTEIN MARKET BY FORM, % PERSONAL CARE AND COSMETICS , GLOBAL, 2023 VS 2029
- Figure 67:
- VOLUME OF MILK PROTEIN MARKET, SUPPLEMENTS END USER, METRIC TONNES, GLOBAL, 2017 – 2029
- Figure 68:
- VALUE OF MILK PROTEIN MARKET, SUPPLEMENTS END USER, USD, GLOBAL, 2017 – 2029
- Figure 69:
- VALUE SHARE OF MILK PROTEIN MARKET BY SUPPLEMENTS END USER, %, GLOBAL, 2017 VS 2023 VS 2029
- Figure 70:
- VOLUME SHARE OF MILK PROTEIN MARKET BY SUPPLEMENTS END USER, %, GLOBAL, 2017 VS 2023 VS 2029
- Figure 71:
- VOLUME OF MILK PROTEIN MARKET, BABY FOOD AND INFANT FORMULA, METRIC TONNES, GLOBAL, 2017 – 2029
- Figure 72:
- VALUE OF MILK PROTEIN MARKET, BABY FOOD AND INFANT FORMULA, USD, GLOBAL, 2017 – 2029
- Figure 73:
- VALUE SHARE OF MILK PROTEIN MARKET BY FORM, % BABY FOOD AND INFANT FORMULA , GLOBAL, 2023 VS 2029
- Figure 74:
- VOLUME OF MILK PROTEIN MARKET, ELDERLY NUTRITION AND MEDICAL NUTRITION, METRIC TONNES, GLOBAL, 2017 – 2029
- Figure 75:
- VALUE OF MILK PROTEIN MARKET, ELDERLY NUTRITION AND MEDICAL NUTRITION, USD, GLOBAL, 2017 – 2029
- Figure 76:
- VALUE SHARE OF MILK PROTEIN MARKET BY FORM, % ELDERLY NUTRITION AND MEDICAL NUTRITION , GLOBAL, 2023 VS 2029
- Figure 77:
- VOLUME OF MILK PROTEIN MARKET, SPORT/PERFORMANCE NUTRITION, METRIC TONNES, GLOBAL, 2017 – 2029
- Figure 78:
- VALUE OF MILK PROTEIN MARKET, SPORT/PERFORMANCE NUTRITION, USD, GLOBAL, 2017 – 2029
- Figure 79:
- VALUE SHARE OF MILK PROTEIN MARKET BY FORM, % SPORT/PERFORMANCE NUTRITION , GLOBAL, 2023 VS 2029
- Figure 80:
- VOLUME OF MILK PROTEIN MARKET BY REGION, METRIC TONNES, GLOBAL, 2017 – 2029
- Figure 81:
- VALUE OF MILK PROTEIN MARKET BY REGION, USD, GLOBAL, 2017 – 2029
- Figure 82:
- VALUE SHARE OF MILK PROTEIN MARKET BY REGION, %, GLOBAL, 2017 VS 2023 VS 2029
- Figure 83:
- VOLUME SHARE OF MILK PROTEIN MARKET BY REGION, %, GLOBAL, 2017 VS 2023 VS 2029
- Figure 84:
- VOLUME OF MILK PROTEIN MARKET BY FORM, METRIC TONNES, AFRICA, 2017 – 2029
- Figure 85:
- VALUE OF MILK PROTEIN MARKET BY FORM, USD, AFRICA, 2017 – 2029
- Figure 86:
- VALUE SHARE OF MILK PROTEIN MARKET BY FORM, %, AFRICA, 2017 VS 2023 VS 2029
- Figure 87:
- VOLUME SHARE OF MILK PROTEIN MARKET BY FORM, %, AFRICA, 2017 VS 2023 VS 2029
- Figure 88:
- VOLUME OF MILK PROTEIN MARKET BY END USER, METRIC TONNES, AFRICA, 2017 – 2029
- Figure 89:
- VALUE OF MILK PROTEIN MARKET BY END USER, USD, AFRICA, 2017 – 2029
- Figure 90:
- VALUE SHARE OF MILK PROTEIN MARKET BY END USER, %, AFRICA, 2017 VS 2023 VS 2029
- Figure 91:
- VOLUME SHARE OF MILK PROTEIN MARKET BY END USER, %, AFRICA, 2017 VS 2023 VS 2029
- Figure 92:
- VOLUME OF MILK PROTEIN MARKET BY COUNTRY, METRIC TONNES, AFRICA, 2017 – 2029
- Figure 93:
- VALUE OF MILK PROTEIN MARKET BY COUNTRY, USD, AFRICA, 2017 – 2029
- Figure 94:
- VALUE SHARE OF MILK PROTEIN MARKET BY COUNTRY, %, AFRICA, 2017 VS 2023 VS 2029
- Figure 95:
- VOLUME SHARE OF MILK PROTEIN MARKET BY COUNTRY, %, AFRICA, 2017 VS 2023 VS 2029
- Figure 96:
- VOLUME OF MILK PROTEIN MARKET, METRIC TONNES, NIGERIA, 2017 – 2029
- Figure 97:
- VALUE OF MILK PROTEIN MARKET, USD, NIGERIA, 2017 – 2029
- Figure 98:
- VALUE SHARE OF MILK PROTEIN MARKET BY END USER, % , NIGERIA, 2023 VS 2029
- Figure 99:
- VOLUME OF MILK PROTEIN MARKET, METRIC TONNES, SOUTH AFRICA, 2017 – 2029
- Figure 100:
- VALUE OF MILK PROTEIN MARKET, USD, SOUTH AFRICA, 2017 – 2029
- Figure 101:
- VALUE SHARE OF MILK PROTEIN MARKET BY END USER, % , SOUTH AFRICA, 2023 VS 2029
- Figure 102:
- VOLUME OF MILK PROTEIN MARKET, METRIC TONNES, REST OF AFRICA, 2017 – 2029
- Figure 103:
- VALUE OF MILK PROTEIN MARKET, USD, REST OF AFRICA, 2017 – 2029
- Figure 104:
- VALUE SHARE OF MILK PROTEIN MARKET BY END USER, % , REST OF AFRICA, 2023 VS 2029
- Figure 105:
- VOLUME OF MILK PROTEIN MARKET BY FORM, METRIC TONNES, ASIA-PACIFIC, 2017 – 2029
- Figure 106:
- VALUE OF MILK PROTEIN MARKET BY FORM, USD, ASIA-PACIFIC, 2017 – 2029
- Figure 107:
- VALUE SHARE OF MILK PROTEIN MARKET BY FORM, %, ASIA-PACIFIC, 2017 VS 2023 VS 2029
- Figure 108:
- VOLUME SHARE OF MILK PROTEIN MARKET BY FORM, %, ASIA-PACIFIC, 2017 VS 2023 VS 2029
- Figure 109:
- VOLUME OF MILK PROTEIN MARKET BY END USER, METRIC TONNES, ASIA-PACIFIC, 2017 – 2029
- Figure 110:
- VALUE OF MILK PROTEIN MARKET BY END USER, USD, ASIA-PACIFIC, 2017 – 2029
- Figure 111:
- VALUE SHARE OF MILK PROTEIN MARKET BY END USER, %, ASIA-PACIFIC, 2017 VS 2023 VS 2029
- Figure 112:
- VOLUME SHARE OF MILK PROTEIN MARKET BY END USER, %, ASIA-PACIFIC, 2017 VS 2023 VS 2029
- Figure 113:
- VOLUME OF MILK PROTEIN MARKET BY COUNTRY, METRIC TONNES, ASIA-PACIFIC, 2017 – 2029
- Figure 114:
- VALUE OF MILK PROTEIN MARKET BY COUNTRY, USD, ASIA-PACIFIC, 2017 – 2029
- Figure 115:
- VALUE SHARE OF MILK PROTEIN MARKET BY COUNTRY, %, ASIA-PACIFIC, 2017 VS 2023 VS 2029
- Figure 116:
- VOLUME SHARE OF MILK PROTEIN MARKET BY COUNTRY, %, ASIA-PACIFIC, 2017 VS 2023 VS 2029
- Figure 117:
- VOLUME OF MILK PROTEIN MARKET, METRIC TONNES, AUSTRALIA, 2017 – 2029
- Figure 118:
- VALUE OF MILK PROTEIN MARKET, USD, AUSTRALIA, 2017 – 2029
- Figure 119:
- VALUE SHARE OF MILK PROTEIN MARKET BY END USER, % , AUSTRALIA, 2023 VS 2029
- Figure 120:
- VOLUME OF MILK PROTEIN MARKET, METRIC TONNES, CHINA, 2017 – 2029
- Figure 121:
- VALUE OF MILK PROTEIN MARKET, USD, CHINA, 2017 – 2029
- Figure 122:
- VALUE SHARE OF MILK PROTEIN MARKET BY END USER, % , CHINA, 2023 VS 2029
- Figure 123:
- VOLUME OF MILK PROTEIN MARKET, METRIC TONNES, INDIA, 2017 – 2029
- Figure 124:
- VALUE OF MILK PROTEIN MARKET, USD, INDIA, 2017 – 2029
- Figure 125:
- VALUE SHARE OF MILK PROTEIN MARKET BY END USER, % , INDIA, 2023 VS 2029
- Figure 126:
- VOLUME OF MILK PROTEIN MARKET, METRIC TONNES, INDONESIA, 2017 – 2029
- Figure 127:
- VALUE OF MILK PROTEIN MARKET, USD, INDONESIA, 2017 – 2029
- Figure 128:
- VALUE SHARE OF MILK PROTEIN MARKET BY END USER, % , INDONESIA, 2023 VS 2029
- Figure 129:
- VOLUME OF MILK PROTEIN MARKET, METRIC TONNES, JAPAN, 2017 – 2029
- Figure 130:
- VALUE OF MILK PROTEIN MARKET, USD, JAPAN, 2017 – 2029
- Figure 131:
- VALUE SHARE OF MILK PROTEIN MARKET BY END USER, % , JAPAN, 2023 VS 2029
- Figure 132:
- VOLUME OF MILK PROTEIN MARKET, METRIC TONNES, MALAYSIA, 2017 – 2029
- Figure 133:
- VALUE OF MILK PROTEIN MARKET, USD, MALAYSIA, 2017 – 2029
- Figure 134:
- VALUE SHARE OF MILK PROTEIN MARKET BY END USER, % , MALAYSIA, 2023 VS 2029
- Figure 135:
- VOLUME OF MILK PROTEIN MARKET, METRIC TONNES, NEW ZEALAND, 2017 – 2029
- Figure 136:
- VALUE OF MILK PROTEIN MARKET, USD, NEW ZEALAND, 2017 – 2029
- Figure 137:
- VALUE SHARE OF MILK PROTEIN MARKET BY END USER, % , NEW ZEALAND, 2023 VS 2029
- Figure 138:
- VOLUME OF MILK PROTEIN MARKET, METRIC TONNES, SOUTH KOREA, 2017 – 2029
- Figure 139:
- VALUE OF MILK PROTEIN MARKET, USD, SOUTH KOREA, 2017 – 2029
- Figure 140:
- VALUE SHARE OF MILK PROTEIN MARKET BY END USER, % , SOUTH KOREA, 2023 VS 2029
- Figure 141:
- VOLUME OF MILK PROTEIN MARKET, METRIC TONNES, THAILAND, 2017 – 2029
- Figure 142:
- VALUE OF MILK PROTEIN MARKET, USD, THAILAND, 2017 – 2029
- Figure 143:
- VALUE SHARE OF MILK PROTEIN MARKET BY END USER, % , THAILAND, 2023 VS 2029
- Figure 144:
- VOLUME OF MILK PROTEIN MARKET, METRIC TONNES, VIETNAM, 2017 – 2029
- Figure 145:
- VALUE OF MILK PROTEIN MARKET, USD, VIETNAM, 2017 – 2029
- Figure 146:
- VALUE SHARE OF MILK PROTEIN MARKET BY END USER, % , VIETNAM, 2023 VS 2029
- Figure 147:
- VOLUME OF MILK PROTEIN MARKET, METRIC TONNES, REST OF ASIA-PACIFIC, 2017 – 2029
- Figure 148:
- VALUE OF MILK PROTEIN MARKET, USD, REST OF ASIA-PACIFIC, 2017 – 2029
- Figure 149:
- VALUE SHARE OF MILK PROTEIN MARKET BY END USER, % , REST OF ASIA-PACIFIC, 2023 VS 2029
- Figure 150:
- VOLUME OF MILK PROTEIN MARKET BY FORM, METRIC TONNES, EUROPE, 2017 – 2029
- Figure 151:
- VALUE OF MILK PROTEIN MARKET BY FORM, USD, EUROPE, 2017 – 2029
- Figure 152:
- VALUE SHARE OF MILK PROTEIN MARKET BY FORM, %, EUROPE, 2017 VS 2023 VS 2029
- Figure 153:
- VOLUME SHARE OF MILK PROTEIN MARKET BY FORM, %, EUROPE, 2017 VS 2023 VS 2029
- Figure 154:
- VOLUME OF MILK PROTEIN MARKET BY END USER, METRIC TONNES, EUROPE, 2017 – 2029
- Figure 155:
- VALUE OF MILK PROTEIN MARKET BY END USER, USD, EUROPE, 2017 – 2029
- Figure 156:
- VALUE SHARE OF MILK PROTEIN MARKET BY END USER, %, EUROPE, 2017 VS 2023 VS 2029
- Figure 157:
- VOLUME SHARE OF MILK PROTEIN MARKET BY END USER, %, EUROPE, 2017 VS 2023 VS 2029
- Figure 158:
- VOLUME OF MILK PROTEIN MARKET BY COUNTRY, METRIC TONNES, EUROPE, 2017 – 2029
- Figure 159:
- VALUE OF MILK PROTEIN MARKET BY COUNTRY, USD, EUROPE, 2017 – 2029
- Figure 160:
- VALUE SHARE OF MILK PROTEIN MARKET BY COUNTRY, %, EUROPE, 2017 VS 2023 VS 2029
- Figure 161:
- VOLUME SHARE OF MILK PROTEIN MARKET BY COUNTRY, %, EUROPE, 2017 VS 2023 VS 2029
- Figure 162:
- VOLUME OF MILK PROTEIN MARKET, METRIC TONNES, BELGIUM, 2017 – 2029
- Figure 163:
- VALUE OF MILK PROTEIN MARKET, USD, BELGIUM, 2017 – 2029
- Figure 164:
- VALUE SHARE OF MILK PROTEIN MARKET BY END USER, % , BELGIUM, 2023 VS 2029
- Figure 165:
- VOLUME OF MILK PROTEIN MARKET, METRIC TONNES, FRANCE, 2017 – 2029
- Figure 166:
- VALUE OF MILK PROTEIN MARKET, USD, FRANCE, 2017 – 2029
- Figure 167:
- VALUE SHARE OF MILK PROTEIN MARKET BY END USER, % , FRANCE, 2023 VS 2029
- Figure 168:
- VOLUME OF MILK PROTEIN MARKET, METRIC TONNES, GERMANY, 2017 – 2029
- Figure 169:
- VALUE OF MILK PROTEIN MARKET, USD, GERMANY, 2017 – 2029
- Figure 170:
- VALUE SHARE OF MILK PROTEIN MARKET BY END USER, % , GERMANY, 2023 VS 2029
- Figure 171:
- VOLUME OF MILK PROTEIN MARKET, METRIC TONNES, ITALY, 2017 – 2029
- Figure 172:
- VALUE OF MILK PROTEIN MARKET, USD, ITALY, 2017 – 2029
- Figure 173:
- VALUE SHARE OF MILK PROTEIN MARKET BY END USER, % , ITALY, 2023 VS 2029
- Figure 174:
- VOLUME OF MILK PROTEIN MARKET, METRIC TONNES, NETHERLANDS, 2017 – 2029
- Figure 175:
- VALUE OF MILK PROTEIN MARKET, USD, NETHERLANDS, 2017 – 2029
- Figure 176:
- VALUE SHARE OF MILK PROTEIN MARKET BY END USER, % , NETHERLANDS, 2023 VS 2029
- Figure 177:
- VOLUME OF MILK PROTEIN MARKET, METRIC TONNES, RUSSIA, 2017 – 2029
- Figure 178:
- VALUE OF MILK PROTEIN MARKET, USD, RUSSIA, 2017 – 2029
- Figure 179:
- VALUE SHARE OF MILK PROTEIN MARKET BY END USER, % , RUSSIA, 2023 VS 2029
- Figure 180:
- VOLUME OF MILK PROTEIN MARKET, METRIC TONNES, SPAIN, 2017 – 2029
- Figure 181:
- VALUE OF MILK PROTEIN MARKET, USD, SPAIN, 2017 – 2029
- Figure 182:
- VALUE SHARE OF MILK PROTEIN MARKET BY END USER, % , SPAIN, 2023 VS 2029
- Figure 183:
- VOLUME OF MILK PROTEIN MARKET, METRIC TONNES, TURKEY, 2017 – 2029
- Figure 184:
- VALUE OF MILK PROTEIN MARKET, USD, TURKEY, 2017 – 2029
- Figure 185:
- VALUE SHARE OF MILK PROTEIN MARKET BY END USER, % , TURKEY, 2023 VS 2029
- Figure 186:
- VOLUME OF MILK PROTEIN MARKET, METRIC TONNES, UNITED KINGDOM, 2017 – 2029
- Figure 187:
- VALUE OF MILK PROTEIN MARKET, USD, UNITED KINGDOM, 2017 – 2029
- Figure 188:
- VALUE SHARE OF MILK PROTEIN MARKET BY END USER, % , UNITED KINGDOM, 2023 VS 2029
- Figure 189:
- VOLUME OF MILK PROTEIN MARKET, METRIC TONNES, REST OF EUROPE, 2017 – 2029
- Figure 190:
- VALUE OF MILK PROTEIN MARKET, USD, REST OF EUROPE, 2017 – 2029
- Figure 191:
- VALUE SHARE OF MILK PROTEIN MARKET BY END USER, % , REST OF EUROPE, 2023 VS 2029
- Figure 192:
- VOLUME OF MILK PROTEIN MARKET BY FORM, METRIC TONNES, MIDDLE EAST, 2017 – 2029
- Figure 193:
- VALUE OF MILK PROTEIN MARKET BY FORM, USD, MIDDLE EAST, 2017 – 2029
- Figure 194:
- VALUE SHARE OF MILK PROTEIN MARKET BY FORM, %, MIDDLE EAST, 2017 VS 2023 VS 2029
- Figure 195:
- VOLUME SHARE OF MILK PROTEIN MARKET BY FORM, %, MIDDLE EAST, 2017 VS 2023 VS 2029
- Figure 196:
- VOLUME OF MILK PROTEIN MARKET BY END USER, METRIC TONNES, MIDDLE EAST, 2017 – 2029
- Figure 197:
- VALUE OF MILK PROTEIN MARKET BY END USER, USD, MIDDLE EAST, 2017 – 2029
- Figure 198:
- VALUE SHARE OF MILK PROTEIN MARKET BY END USER, %, MIDDLE EAST, 2017 VS 2023 VS 2029
- Figure 199:
- VOLUME SHARE OF MILK PROTEIN MARKET BY END USER, %, MIDDLE EAST, 2017 VS 2023 VS 2029
- Figure 200:
- VOLUME OF MILK PROTEIN MARKET BY COUNTRY, METRIC TONNES, MIDDLE EAST, 2017 – 2029
- Figure 201:
- VALUE OF MILK PROTEIN MARKET BY COUNTRY, USD, MIDDLE EAST, 2017 – 2029
- Figure 202:
- VALUE SHARE OF MILK PROTEIN MARKET BY COUNTRY, %, MIDDLE EAST, 2017 VS 2023 VS 2029
- Figure 203:
- VOLUME SHARE OF MILK PROTEIN MARKET BY COUNTRY, %, MIDDLE EAST, 2017 VS 2023 VS 2029
- Figure 204:
- VOLUME OF MILK PROTEIN MARKET, METRIC TONNES, IRAN, 2017 – 2029
- Figure 205:
- VALUE OF MILK PROTEIN MARKET, USD, IRAN, 2017 – 2029
- Figure 206:
- VALUE SHARE OF MILK PROTEIN MARKET BY END USER, % , IRAN, 2023 VS 2029
- Figure 207:
- VOLUME OF MILK PROTEIN MARKET, METRIC TONNES, SAUDI ARABIA, 2017 – 2029
- Figure 208:
- VALUE OF MILK PROTEIN MARKET, USD, SAUDI ARABIA, 2017 – 2029
- Figure 209:
- VALUE SHARE OF MILK PROTEIN MARKET BY END USER, % , SAUDI ARABIA, 2023 VS 2029
- Figure 210:
- VOLUME OF MILK PROTEIN MARKET, METRIC TONNES, UNITED ARAB EMIRATES, 2017 – 2029
- Figure 211:
- VALUE OF MILK PROTEIN MARKET, USD, UNITED ARAB EMIRATES, 2017 – 2029
- Figure 212:
- VALUE SHARE OF MILK PROTEIN MARKET BY END USER, % , UNITED ARAB EMIRATES, 2023 VS 2029
- Figure 213:
- VOLUME OF MILK PROTEIN MARKET, METRIC TONNES, REST OF MIDDLE EAST, 2017 – 2029
- Figure 214:
- VALUE OF MILK PROTEIN MARKET, USD, REST OF MIDDLE EAST, 2017 – 2029
- Figure 215:
- VALUE SHARE OF MILK PROTEIN MARKET BY END USER, % , REST OF MIDDLE EAST, 2023 VS 2029
- Figure 216:
- VOLUME OF MILK PROTEIN MARKET BY FORM, METRIC TONNES, NORTH AMERICA, 2017 – 2029
- Figure 217:
- VALUE OF MILK PROTEIN MARKET BY FORM, USD, NORTH AMERICA, 2017 – 2029
- Figure 218:
- VALUE SHARE OF MILK PROTEIN MARKET BY FORM, %, NORTH AMERICA, 2017 VS 2023 VS 2029
- Figure 219:
- VOLUME SHARE OF MILK PROTEIN MARKET BY FORM, %, NORTH AMERICA, 2017 VS 2023 VS 2029
- Figure 220:
- VOLUME OF MILK PROTEIN MARKET BY END USER, METRIC TONNES, NORTH AMERICA, 2017 – 2029
- Figure 221:
- VALUE OF MILK PROTEIN MARKET BY END USER, USD, NORTH AMERICA, 2017 – 2029
- Figure 222:
- VALUE SHARE OF MILK PROTEIN MARKET BY END USER, %, NORTH AMERICA, 2017 VS 2023 VS 2029
- Figure 223:
- VOLUME SHARE OF MILK PROTEIN MARKET BY END USER, %, NORTH AMERICA, 2017 VS 2023 VS 2029
- Figure 224:
- VOLUME OF MILK PROTEIN MARKET BY COUNTRY, METRIC TONNES, NORTH AMERICA, 2017 – 2029
- Figure 225:
- VALUE OF MILK PROTEIN MARKET BY COUNTRY, USD, NORTH AMERICA, 2017 – 2029
- Figure 226:
- VALUE SHARE OF MILK PROTEIN MARKET BY COUNTRY, %, NORTH AMERICA, 2017 VS 2023 VS 2029
- Figure 227:
- VOLUME SHARE OF MILK PROTEIN MARKET BY COUNTRY, %, NORTH AMERICA, 2017 VS 2023 VS 2029
- Figure 228:
- VOLUME OF MILK PROTEIN MARKET, METRIC TONNES, CANADA, 2017 – 2029
- Figure 229:
- VALUE OF MILK PROTEIN MARKET, USD, CANADA, 2017 – 2029
- Figure 230:
- VALUE SHARE OF MILK PROTEIN MARKET BY END USER, % , CANADA, 2023 VS 2029
- Figure 231:
- VOLUME OF MILK PROTEIN MARKET, METRIC TONNES, MEXICO, 2017 – 2029
- Figure 232:
- VALUE OF MILK PROTEIN MARKET, USD, MEXICO, 2017 – 2029
- Figure 233:
- VALUE SHARE OF MILK PROTEIN MARKET BY END USER, % , MEXICO, 2023 VS 2029
- Figure 234:
- VOLUME OF MILK PROTEIN MARKET, METRIC TONNES, UNITED STATES, 2017 – 2029
- Figure 235:
- VALUE OF MILK PROTEIN MARKET, USD, UNITED STATES, 2017 – 2029
- Figure 236:
- VALUE SHARE OF MILK PROTEIN MARKET BY END USER, % , UNITED STATES, 2023 VS 2029
- Figure 237:
- VOLUME OF MILK PROTEIN MARKET, METRIC TONNES, REST OF NORTH AMERICA, 2017 – 2029
- Figure 238:
- VALUE OF MILK PROTEIN MARKET, USD, REST OF NORTH AMERICA, 2017 – 2029
- Figure 239:
- VALUE SHARE OF MILK PROTEIN MARKET BY END USER, % , REST OF NORTH AMERICA, 2023 VS 2029
- Figure 240:
- VOLUME OF MILK PROTEIN MARKET BY FORM, METRIC TONNES, SOUTH AMERICA, 2017 – 2029
- Figure 241:
- VALUE OF MILK PROTEIN MARKET BY FORM, USD, SOUTH AMERICA, 2017 – 2029
- Figure 242:
- VALUE SHARE OF MILK PROTEIN MARKET BY FORM, %, SOUTH AMERICA, 2017 VS 2023 VS 2029
- Figure 243:
- VOLUME SHARE OF MILK PROTEIN MARKET BY FORM, %, SOUTH AMERICA, 2017 VS 2023 VS 2029
- Figure 244:
- VOLUME OF MILK PROTEIN MARKET BY END USER, METRIC TONNES, SOUTH AMERICA, 2017 – 2029
- Figure 245:
- VALUE OF MILK PROTEIN MARKET BY END USER, USD, SOUTH AMERICA, 2017 – 2029
- Figure 246:
- VALUE SHARE OF MILK PROTEIN MARKET BY END USER, %, SOUTH AMERICA, 2017 VS 2023 VS 2029
- Figure 247:
- VOLUME SHARE OF MILK PROTEIN MARKET BY END USER, %, SOUTH AMERICA, 2017 VS 2023 VS 2029
- Figure 248:
- VOLUME OF MILK PROTEIN MARKET BY COUNTRY, METRIC TONNES, SOUTH AMERICA, 2017 – 2029
- Figure 249:
- VALUE OF MILK PROTEIN MARKET BY COUNTRY, USD, SOUTH AMERICA, 2017 – 2029
- Figure 250:
- VALUE SHARE OF MILK PROTEIN MARKET BY COUNTRY, %, SOUTH AMERICA, 2017 VS 2023 VS 2029
- Figure 251:
- VOLUME SHARE OF MILK PROTEIN MARKET BY COUNTRY, %, SOUTH AMERICA, 2017 VS 2023 VS 2029
- Figure 252:
- VOLUME OF MILK PROTEIN MARKET, METRIC TONNES, ARGENTINA, 2017 – 2029
- Figure 253:
- VALUE OF MILK PROTEIN MARKET, USD, ARGENTINA, 2017 – 2029
- Figure 254:
- VALUE SHARE OF MILK PROTEIN MARKET BY END USER, % , ARGENTINA, 2023 VS 2029
- Figure 255:
- VOLUME OF MILK PROTEIN MARKET, METRIC TONNES, BRAZIL, 2017 – 2029
- Figure 256:
- VALUE OF MILK PROTEIN MARKET, USD, BRAZIL, 2017 – 2029
- Figure 257:
- VALUE SHARE OF MILK PROTEIN MARKET BY END USER, % , BRAZIL, 2023 VS 2029
- Figure 258:
- VOLUME OF MILK PROTEIN MARKET, METRIC TONNES, REST OF SOUTH AMERICA, 2017 – 2029
- Figure 259:
- VALUE OF MILK PROTEIN MARKET, USD, REST OF SOUTH AMERICA, 2017 – 2029
- Figure 260:
- VALUE SHARE OF MILK PROTEIN MARKET BY END USER, % , REST OF SOUTH AMERICA, 2023 VS 2029
- Figure 261:
- MOST ACTIVE COMPANIES BY NUMBER OF STRATEGIC MOVES, COUNT, GLOBAL MILK PROTEIN MARKET, 2017 – 2023
- Figure 262:
- MOST ADOPTED STRATEGIES, COUNT, GLOBAL, 2017 – 2023
- Figure 263:
- VALUE SHARE OF MAJOR PLAYERS, %, GLOBAL MILK PROTEIN MARKET
Milk Protein Industry Segmentation
Concentrates, Hydrolyzed, Isolates are covered as segments by Form. Animal Feed, Food and Beverages, Personal Care and Cosmetics, Supplements are covered as segments by End User. Africa, Asia-Pacific, Europe, Middle East, North America, South America are covered as segments by Region.
- By application, the F&B sector retained the top position in the market throughout the review period. By volume, 85.67% of milk protein demand in the F&B segment was driven by the bakery, snacks, and beverage industries in 2022. Milk proteins are gaining popularity in low-acid beverages due to their greater solubility and heat stability. Similarly, milk proteins’ high efficacy in egg replacement boosted its demand in the bakery industry, especially in countries where avian flu is a budding concern. Hence, the use of milk proteins in the F&B segment is anticipated to register a CAGR of 4.55%, by volume, during the forecast period.
- On the other hand, the supplements sector also recorded a significant global demand. This was led by the growing demand for the sport and performance nutrition and baby food and infant formula industries, which accounted for shares of 33% and 66%, by volume, respectively, in the supplements segment. Sports and performance nutrition is projected to be the fastest-growing among all supplements sub-segments, recording a CAGR of 6.08% during the forecast period. Milk protein is an excellent alternative for bodybuilders due to its ability to offer a whey-to-casein ratio of 20:80. More than 75% of Americans take dietary supplements every year; with 79% of female adults and 74% of male adults claiming to consume at least one form of supplements with their diet.
- In June 2020, the FDA decided to allow the inclusion of milk protein concentrate (MPC), milk protein isolate (MPI), and a few additional additives in products branded as “high protein milk,” which is further expected to propel the market segment during the forecast period.
| Form | Concentrates | ||
| Hydrolyzed | |||
| Isolates | |||
| End User | Animal Feed | ||
| Food and Beverages | By Sub End User | Bakery | |
| Beverages | |||
| Breakfast Cereals | |||
| Condiments/Sauces | |||
| Dairy and Dairy Alternative Products | |||
| RTE/RTC Food Products | |||
| Snacks | |||
| Personal Care and Cosmetics | |||
| Supplements | By Sub End User | Baby Food and Infant Formula | |
| Elderly Nutrition and Medical Nutrition | |||
| Sport/Performance Nutrition | |||
| Region | Africa | By Form | |
| By End User | |||
| By Country | Nigeria | ||
| South Africa | |||
| Rest of Africa | |||
| Region | Asia-Pacific | By Form | |
| By End User | |||
| By Country | Australia | ||
| China | |||
| India | |||
| Indonesia | |||
| Japan | |||
| Malaysia | |||
| New Zealand | |||
| South Korea | |||
| Thailand | |||
| Vietnam | |||
| Rest of Asia-Pacific | |||
| Region | Europe | By Form | |
| By End User | |||
| By Country | Belgium | ||
| France | |||
| Germany | |||
| Italy | |||
| Netherlands | |||
| Russia | |||
| Spain | |||
| Turkey | |||
| United Kingdom | |||
| Rest of Europe | |||
| Region | Middle East | By Form | |
| By End User | |||
| By Country | Iran | ||
| Saudi Arabia | |||
| United Arab Emirates | |||
| Rest of Middle East | |||
| Region | North America | By Form | |
| By End User | |||
| By Country | Canada | ||
| Mexico | |||
| United States | |||
| Rest of North America | |||
| Region | South America | By Form | |
| By End User | |||
| By Country | Argentina | ||
| Brazil | |||
| Rest of South America |
Market Definition
- End User – The Protein Ingredients Market operates on a B2B basis. Food, Beverages, Supplements, Animal Feed, and Personal Care & Cosmetic manufacturers are considered to be end-consumers in the market studied. The scope excludes manufacturers buying liquid/dry whey to be used for application as a binding agent or thickener or other non-protein applications.
- Penetration Rate – Penetration Rate is defined as the percentage of Protein-Fortified End User Market Volume in the Overall End User Market Volume.
- Average Protein Content – Average protein content is the average protein content present per 100 g of product manufactured by all end-user companies considered under the scope of this report.
- End User Market Volume – End-user market volume is the consolidated volume of all types and forms of end-user products in the country or region.
| Keyword | Definition |
|---|---|
| Alpha-lactalbumin (α-Lactalbumin) | It is a protein that regulates the production of lactose in the milk of almost all mammalian species. |
| Amino acid | It is an organic compound that contains both amino and carboxylic acid functional groups, which are required for the synthesis of body protein and other important nitrogen-containing compounds, such as creatine, peptide hormones, and some neurotransmitters. |
| Blanching | It is the process of briefly heating vegetables with steam or boiling water. |
| BRC | British Retail Consortium |
| Bread improver | It is a flour-based blend of several components with specific functional properties designed to modify dough characteristics and give quality attributes to bread. |
| BSF | Black Soldier Fly |
| Caseinate | It is a substance produced by adding an alkali to acid casein, a derivative of casein. |
| Celiac disease | Celiac disease is an immune reaction to eating gluten, a protein found in wheat, barley, and rye. |
| Colostrum | It is a milky fluid that’s released by mammals that have recently given birth before breast milk production begins. |
| Concentrate | It is the least processed form of protein and has a protein content ranging from 40-90% by weight. |
| Dry protein basis | It refers to the percentage of “pure protein” present in a supplement after the water in it is completely removed through heat. |
| Dry whey | It is the product resulting from drying fresh whey which has been pasteurized and to which nothing has been added as a preservative. |
| Egg protein | It is a mixture of individual proteins, including ovalbumin, ovomucoid, ovoglobulin, conalbumin, vitellin, and vitellenin. |
| Emulsifier | It is a food additive that facilitates the blending of foods that are immiscible with one another, such as oil and water. |
| Enrichment | It is the process of addition of micronutrients that are lost during the processing of the product. |
| ERS | Economic Research Service of the USDA |
| Extrusion | It is the process of forcing soft mixed ingredients through an opening in a perforated plate or die designed to produce the required shape. The extruded food is then cut to a specific size by blades. |
| Fava | Also known as Faba, it is another word for yellow split beans. |
| FDA | Food and Drug Administration |
| Flaking | It is a process in which typically a cereal grain (like corn, wheat, or rice) is broken down into grits, cooked with flavors and syrups, and then pressed into flakes between cooled rollers. |
| Foaming agent | It is a food ingredient that makes it possible to form or maintain a uniform dispersion of a gaseous phase in a liquid or solid food. |
| Foodservice | It refers to the part of the food industry which includes businesses, institutions, and companies which prepare meals outside the home. It includes restaurants, school and hospital cafeterias, catering operations, and many other formats. |
| Fortification | It is the deliberate addition of micronutrients that are not found in them naturally or which are lost during processing, to improve a food product’s nutritional value. |
| FSANZ | Food Standards Australia New Zealand |
| FSIS | Food Safety and Inspection Service |
| FSSAI | Food Safety and Standards Authority of India |
| Gelling agent | It is an ingredient that functions as a stabilizer and thickener to provide thickening without stiffness through the formation of gel. |
| GHG | Greenhouse Gas |
| Gluten | It is a family of proteins found in grains, including wheat, rye, spelt, and barley. |
| Hemp | It is a botanical class of Cannabis sativa cultivars grown specifically for industrial or medicinal use. |
| Hydrolysate | It is a form of protein manufactured by exposing the protein to enzymes that can partially break the bonds between the protein’s amino acids and break down large, complicated proteins into smaller pieces. Its processing makes it easier and quicker to digest. |
| Hypoallergenic | It refers to a substance that causes fewer allergic reactions. |
| Isolate | It is the purest and most processed form of protein which has undergone separation to obtain a pure protein fraction. It typically contains ≥ 90% of protein by weight. |
| Keratin | It is a protein that helps form hair, nails, and the outer layer of skin. |
| Lactalbumin | It is the albumin contained in milk and obtained from whey. |
| Lactoferrin | It is an iron‑binding glycoprotein that is present in the milk of most mammals. |
| Lupin | It is the yellow legume seeds of the genus Lupinus. |
| Millenial | Also known as Generation Y or Gen Y, it refers to the people born from 1981 to 1996. |
| Monogastric | It refers to an animal with a single-compartmented stomach. Examples of monogastric include humans, poultry, pigs, horses, rabbits, dogs, and cats. Most monogastric are generally unable to digest much cellulose food materials such as grasses. |
| MPC | Milk protein concentrate |
| MPI | Milk protein isolate |
| MSPI | Methylated soy protein isolate |
| Mycoprotein | Mycoprotein is a form of single-cell protein, also known as fungal protein, derived from fungi for human consumption. |
| Nutricosmetics | It is a category of products and ingredients that act as nutritional supplements to care for skin, nails, and hair natural beauty. |
| Osteoporosis | It is a medical condition in which the bones become brittle and fragile from loss of tissue, typically as a result of hormonal changes, or deficiency of calcium or vitamin D. |
| PDCAAS | Protein digestibility-corrected amino acid score (PDCAAS) is a method of evaluating the quality of a protein based on both the amino acid requirements of humans and their ability to digest it. |
| Per-capita consumption of animal protein | It is the average amount of animal protein (such as milk, whey, gelatin, collagen, and egg proteins) that is readily available for consumption by each person in an actual population. |
| Per-capita consumption of plant protein | It is the average amount of plant protein (such as soy, wheat, pea, oat, and hemp proteins) that is readily available for consumption by each person in an actual population. |
| Quorn | It is a microbial protein manufactured using mycoprotein as an ingredient, in which the fungus culture is dried and mixed with egg albumen or potato protein, which acts as a binder, and then is adjusted in texture and pressed into various forms. |
| Ready-to-Cook (RTC) | It refers to food products that include all of the ingredients, where some preparation or cooking is required through a process that is given on the package. |
| Ready-to-Eat (RTE) | It refers to a food product prepared or cooked in advance, with no further cooking or preparation required before being eaten. |
| RTD | Ready-to-Drink |
| RTS | Ready-to-Serve |
| Saturated fat | It is a type of fat in which the fatty acid chains have all single bonds. It is generally considered unhealthy. |
| Sausage | It is a meat product made of finely chopped and seasoned meat, which may be fresh, smoked, or pickled and which is then usually stuffed into a casing. |
| Seitan | It is a plant-based meat substitute made out of wheat gluten. |
| Softgel | It is a gelatin-based capsule with a liquid fill. |
| SPC | Soy protein concentrate |
| SPI | Soy protein isolate |
| Spirulina | It is a biomass of cyanobacteria that can be consumed by humans and animals. |
| Stabilizer | It is an ingredient added to food products to help maintain or enhance their original texture, and physical and chemical characteristics. |
| Supplementation | It is the consumption or provision of concentrated sources of nutrients or other substances that are intended to supplement nutrients in the diet and is intended to correct nutritional deficiencies. |
| Texturant | It is a specific type of food ingredient that is used to control and alter the mouthfeel and texture of food and beverage products. |
| Thickener | It is an ingredient that is used to increase the viscosity of a liquid or dough and make it thicker, without substantially changing its other properties. |
| Trans fat | Also called trans-unsaturated fatty acids or trans fatty acids, it is a type of unsaturated fat that naturally occurs in small amounts in meat. |
| TSP | Textured soy protein |
| TVP | Textured vegetable protein |
| WPC | Whey protein concentrate |
| WPI | Whey protein isolate |
Milk Protein Market Research FAQs
How big is the Global Milk Protein Market?
The Global Milk Protein Market size is expected to reach USD 1.38 billion in 2025 and grow at a CAGR of 5.52% to reach USD 1.80 billion by 2030.
What is the current Global Milk Protein Market size?
In 2025, the Global Milk Protein Market size is expected to reach USD 1.38 billion.
Who are the key players in Global Milk Protein Market?
Agrial Enterprise, Fonterra Co-operative Group Limited, Glanbia PLC, Kerry Group PLC and Royal FrieslandCampina NV are the major companies operating in the Global Milk Protein Market.
Which segment has the biggest share in the Global Milk Protein Market?
In the Global Milk Protein Market, the Food and Beverages segment accounts for the largest share by end user.
Which region has the biggest share in the Global Milk Protein Market?
In 2025, Asia-Pacific accounts for the largest share by region in the Global Milk Protein Market.
What years does this Global Milk Protein Market cover, and what was the market size in 2025?
In 2025, the Global Milk Protein Market size was estimated at 1.38 billion. The report covers the Global Milk Protein Market historical market size for years: 2017, 2018, 2019, 2020, 2021, 2022, 2023 and 2024. The report also forecasts the Global Milk Protein Market size for years: 2025, 2026, 2027, 2028, 2029 and 2030.