
Biopesticides Market Size

Key Players
Biopesticides Market Analysis
The Biopesticides Market size is estimated at 6.72 billion USD in 2025, and is expected to reach 11.41 billion USD by 2030, growing at a CAGR of 11.19% during the forecast period (2025-2030).
6.72 Billion
Market Size in 2025 (USD)
11.41 Billion
Market Size in 2030 (USD)
7.86 %
CAGR (2017-2024)
11.19 %
CAGR (2025-2030)
Largest by Form
47.52 %
value share, Biofungicides, 2024
Commercial bio-fungicides available in the market provide protection against various pathogens such as Pythium, Rhizoctonia, Fusarium, Sclerotinia, Thielaviopsis, and Botrytis
Fastest by Form
12.44 %
Projected CAGR, Bioinsecticides, 2025-2030
The application of Bioinsecticides in different pest-infested crops has significantly increased the mortality of harmful insects and decreased their progeny number.
Largest by Crop Type
84.14 %
value share, Row Crops, 2024
Rice, wheat, corn, soybean, sorghum, and barley are the major organic row crops produced and their dominanance in biopesticide consumption is due to the large organic area.
Largest by Region
39.51 %
value share, North America, 2024
The growing area under cultivation of organic crops and high adaption of biological solutions by the farmers of the region has made it the large consumer of biopesticides globally.
Leading Market Player
4.35 %
market share, Corteva Agriscience,
Corteva Agriscience provide crop protection products have the ability to fight weeds, diseases, insects, and nematodes while maintaining nitrogen in the root zone.
- Biopesticides are made from natural materials such as animals, plants, bacteria, and certain minerals. They are used to control pests in an environmentally friendly way by harnessing natural mechanisms of control. Biopesticides are often selective, and they target specific pests, thereby reducing the impact on non-target species and the environment. Biopesticides are also typically less toxic to humans and animals, and they break down more quickly in the environment.
- Biofungicides are the most popularly used biopesticides. They held a market share of 47.6% in 2022. Bacillus, Trichoderma, Streptomyces, and Pseudomonas are the most commercially used species of microorganisms in agriculture. These biofungicides effectively act against pathogens, such as Pythium, Rhizoctonia, Fusarium, Sclerotinia, Thielaviopsis, Botrytis, and powdery mildew.
- Bioinsecticides accounted for 27.9% of the global biopesticides market in 2022. There are several pests that cause devastating losses to specific crops in each season, which can be effectively controlled by using target-specific bioinsecticides. For instance, cotton is an important cash crop grown globally. The cotton bollworm pest affects the yield of cotton plants, irrespective of the region. Bacillus thuringiensis, a commercially important bioinsecticide, is known to effectively control this devastating pest that can cause potential yield losses of 30-90%.
- The effectiveness of biopesticides in controlling target-specific pests and diseases with no harm to the environment and animals is expected to drive the global market for biopesticides. The biopesticides market is estimated to register a CAGR of 11.0% between 2023 and 2029.

- Biopesticides are used to control pests in an eco-friendly way by harnessing natural control mechanisms. Biopesticides are often selective and target specific pests, reducing the impact on non-target species and the environment. Asia-Pacific and North America were the most biopesticides-consuming regions in 2022.
- The Asia-Pacific region, which is home to large agricultural countries like China and India, has seen significant growth in organic farming. This growth has been driven by rising demand for sustainable and healthier food options and increased awareness about the harmful effects of conventional pesticides. The organic crop area in the region increased from 3.1 million hectares in 2017 to 3.6 million hectares in 2021, representing a growth of 15.5% during the period.
- North America is the second most biopesticides-consuming region, and it had a share of 38.5% in 2021. The demand for organic food in the region is growing rapidly. The average per capita spending on organic food products in North America was recorded as USD 109.7 in 2021. Farmers of the region are adapting to new biological technologies at a faster pace. The trend toward sustainable agriculture is expected to drive the usage of biopesticides in the region.
- Government initiatives and promotion of organic farming in different regions further intensify this trend of sustainable approaches. For instance, the European Commission has unveiled an action plan to increase the organic area in the member countries to occupy 25.0% of the region’s agricultural land area by 2030. Government authorities in South American countries like Peru and Argentina have banned the usage of chemical pesticides, thus driving the South American biopesticides market.
Global Biopesticides Market Trends
Organic production is at an all-time high in North America and Europe, due to the increasing awareness and Government initiatives.
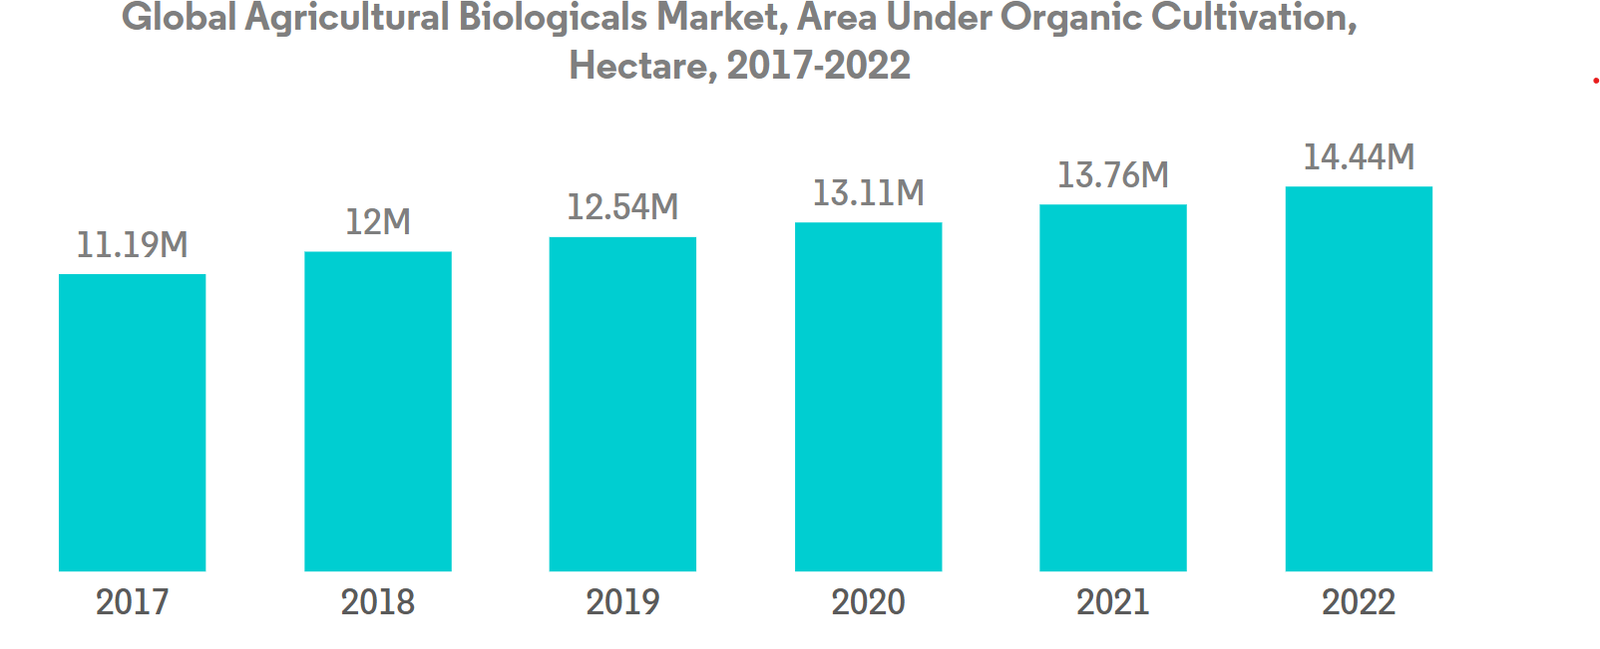
- Organic agriculture has emerged as a significant contributor to sustainable food systems, with 187 countries practicing it globally. As of 2021, there was 72.3 million ha of organic agricultural land worldwide, with an average increase of 2.9% across all regions from 2018 to 2021. Organic arable land accounted for 14.4 million ha, representing 19.9% of the total organic agricultural land.
- The strongest markets for organic farming are North America and Europe, accounting for 41.0% of the global organic arable land. In 2022, Europe had 6.5 million ha of organic arable land, equivalent to 44.1% of the overall organic arable agricultural area. The most significant crops grown organically in North America and Europe are apples, strawberries, cereals, and olives.
- Developing countries in Asia-Pacific are also joining the organic agriculture movement and becoming self-sufficient in producing and providing fresh organic produce to meet their domestic demand. The trend of organic farming is gaining momentum in Asia-Pacific, with the region recording an 18.8% increase in organic arable land from 2017 to 2022. The major initiatives by governments in the region also play a vital role in the growing trend of organic farming. For example, Japan’s Basic Plan for Food, Agriculture, and Rural Areas aims to triple the number of organic farmers and lands by 2030.
- Organic agriculture is becoming increasingly popular worldwide, with more countries adopting it to achieve sustainable food systems. The growth in organic agriculture is driven by the increasing awareness of the benefits of organic farming, such as promoting soil health, reducing negative environmental impacts, and producing healthier food.

Per capita spending of organic food majorly observed in United States and Germany, attributed to the consumer demand for healthier and sustainable food
- The organic food market experienced significant growth in the past few years, with global sales reaching USD 120.6 billion in 2020, up from USD 70.8 billion in 2012. The trend toward organic food is being driven by several factors, such as increasing consumer demand for healthier, more sustainable food options and a growing awareness of the environmental impact of conventional agriculture. The global organic food market is expected to continue its growth trend over the coming years.
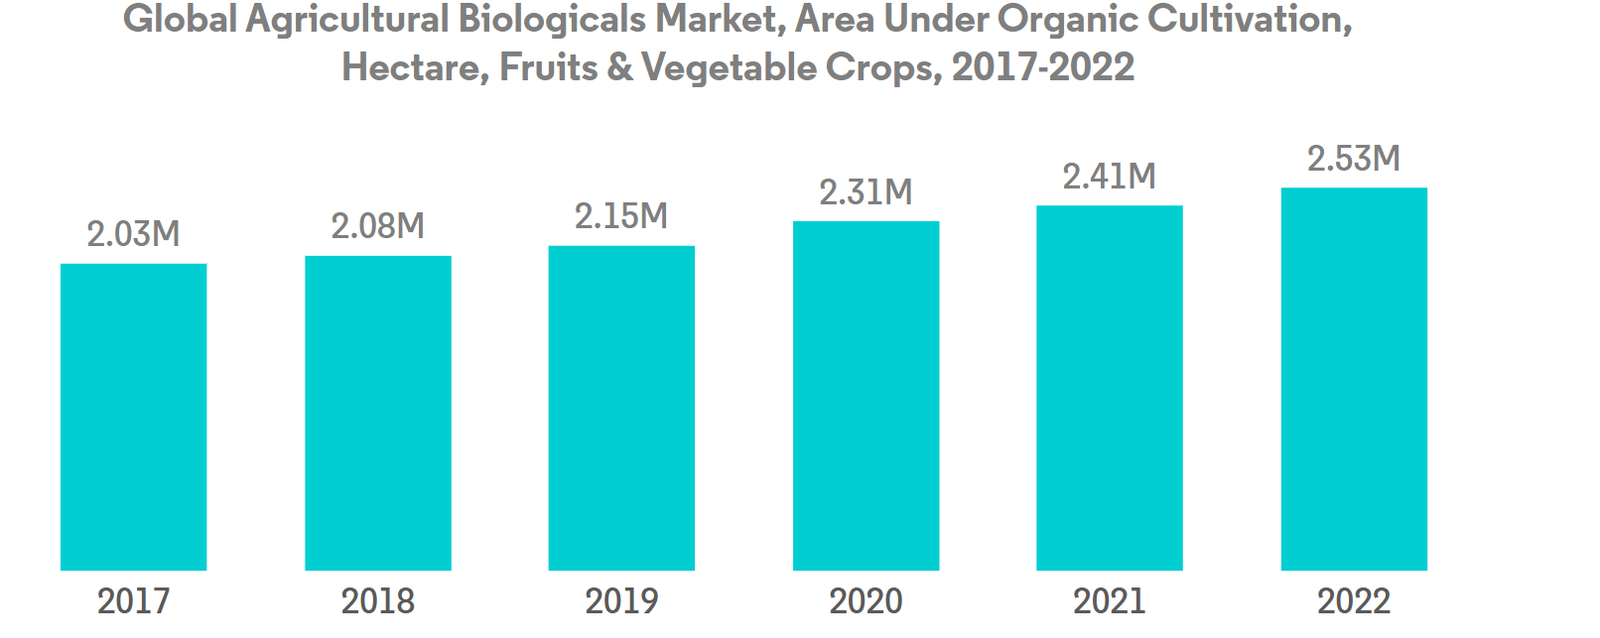
- According to a survey conducted by the Organic Trade Association in 2021, sales of organic fruits and vegetables increased by around 4.5% in the same year, accounting for 15% of the overall organic sales. North America dominates the market in terms of average spending on organic products, with per capita spending in the United States reaching USD 186.7 in 2021, the highest among all North American countries. Europe is also expected to experience significant growth in the organic food market, with Germany accounting for the highest per capita spending of USD 75.6 in 2021.
- While the organic food market is still dominated by developed countries with high consumer disposable incomes, it is also expected to grow in developing nations. For example, the increasing number of working-class people in the Asia-Pacific region may contribute to the market’s expansion due to the growing availability and affordability of organic food products.

Biopesticides Industry Overview
The Biopesticides Market is fragmented, with the top five companies occupying 6.03%. The major players in this market are Corteva Agriscience, Gujarat State Fertilizers & Chemicals Ltd, Koppert Biological Systems Inc., Marrone Bio Innovations Inc. and Valent Biosciences LLC (sorted alphabetically).
Biopesticides Market Leaders
- Corteva Agriscience
- Gujarat State Fertilizers & Chemicals Ltd
- Koppert Biological Systems Inc.
- Marrone Bio Innovations Inc.
- Valent Biosciences LLC

Other important companies include Andermatt Group AG, Atlántica Agrícola, Biolchim SPA, Bioworks Inc., Certis USA LLC, Henan Jiyuan Baiyun Industry Co. Ltd, IPL Biologicals Limited, Lallemand Inc., Seipasa SA, T Stanes and Company Limited.
*Disclaimer: Major Players sorted in alphabetical order.
Biopesticides Market News
- October 2022: Seipasa launched its new advanced biofungicidal product, “Fungisei,” in France, after getting registered phytosaniritarily by the European Commission.
- September 2022: Corteva Agriscience signed an agreement to acquire Symborg, a biologicals-based company, as a part of its strategy to expand its biologicals portfolio. The move was aimed at helping Corteva Agriscience in achieving its aim to become a global leader in the agricultural biologicals market.
- June 2022: Certis Biologicals and Novozymes, two leading agricultural biotechnology companies, collaborated to develop new technologies for highly effective fungal disease control. This collaboration will provide new solutions to row crop growers.
Biopesticides Market Report – Table of Contents
1. EXECUTIVE SUMMARY & KEY FINDINGS
2. REPORT OFFERS
3. INTRODUCTION
- 3.1 Study Assumptions & Market Definition
- 3.2 Scope of the Study
- 3.3 Research Methodology
4. KEY INDUSTRY TRENDS
- 4.1 Area Under Organic Cultivation
- 4.2 Per Capita Spending On Organic Products
- 4.3 Regulatory Framework
- 4.3.1 Argentina
- 4.3.2 Australia
- 4.3.3 Brazil
- 4.3.4 Canada
- 4.3.5 China
- 4.3.6 Egypt
- 4.3.7 France
- 4.3.8 Germany
- 4.3.9 India
- 4.3.10 Indonesia
- 4.3.11 Iran
- 4.3.12 Italy
- 4.3.13 Japan
- 4.3.14 Mexico
- 4.3.15 Netherlands
- 4.3.16 Nigeria
- 4.3.17 Philippines
- 4.3.18 Russia
- 4.3.19 South Africa
- 4.3.20 Spain
- 4.3.21 Thailand
- 4.3.22 Turkey
- 4.3.23 United Kingdom
- 4.3.24 United States
- 4.3.25 Vietnam
- 4.4 Value Chain & Distribution Channel Analysis
5. MARKET SEGMENTATION (includes market size in Value in USD and Volume, Forecasts up to 2030 and analysis of growth prospects)
- 5.1 Form
- 5.1.1 Biofungicides
- 5.1.2 Bioherbicides
- 5.1.3 Bioinsecticides
- 5.1.4 Other Biopesticides
- 5.2 Crop Type
- 5.2.1 Cash Crops
- 5.2.2 Horticultural Crops
- 5.2.3 Row Crops
- 5.3 Region
- 5.3.1 Africa
- 5.3.1.1 By Country
- 5.3.1.1.1 Egypt
- 5.3.1.1.2 Nigeria
- 5.3.1.1.3 South Africa
- 5.3.1.1.4 Rest of Africa
- 5.3.2 Asia-Pacific
- 5.3.2.1 By Country
- 5.3.2.1.1 Australia
- 5.3.2.1.2 China
- 5.3.2.1.3 India
- 5.3.2.1.4 Indonesia
- 5.3.2.1.5 Japan
- 5.3.2.1.6 Philippines
- 5.3.2.1.7 Thailand
- 5.3.2.1.8 Vietnam
- 5.3.2.1.9 Rest of Asia-Pacific
- 5.3.3 Europe
- 5.3.3.1 By Country
- 5.3.3.1.1 France
- 5.3.3.1.2 Germany
- 5.3.3.1.3 Italy
- 5.3.3.1.4 Netherlands
- 5.3.3.1.5 Russia
- 5.3.3.1.6 Spain
- 5.3.3.1.7 Turkey
- 5.3.3.1.8 United Kingdom
- 5.3.3.1.9 Rest of Europe
- 5.3.4 Middle East
- 5.3.4.1 By Country
- 5.3.4.1.1 Iran
- 5.3.4.1.2 Saudi Arabia
- 5.3.4.1.3 Rest of Middle East
- 5.3.5 North America
- 5.3.5.1 By Country
- 5.3.5.1.1 Canada
- 5.3.5.1.2 Mexico
- 5.3.5.1.3 United States
- 5.3.5.1.4 Rest of North America
- 5.3.6 South America
- 5.3.6.1 By Country
- 5.3.6.1.1 Argentina
- 5.3.6.1.2 Brazil
- 5.3.6.1.3 Rest of South America
6. COMPETITIVE LANDSCAPE
- 6.1 Key Strategic Moves
- 6.2 Market Share Analysis
- 6.3 Company Landscape
- 6.4 Company Profiles (includes Global Level Overview, Market Level Overview, Core Business Segments, Financials, Headcount, Key Information, Market Rank, Market Share, Products and Services, and Analysis of Recent Developments).
- 6.4.1 Andermatt Group AG
- 6.4.2 Atlántica Agrícola
- 6.4.3 Biolchim SPA
- 6.4.4 Bioworks Inc.
- 6.4.5 Certis USA LLC
- 6.4.6 Corteva Agriscience
- 6.4.7 Gujarat State Fertilizers & Chemicals Ltd
- 6.4.8 Henan Jiyuan Baiyun Industry Co. Ltd
- 6.4.9 IPL Biologicals Limited
- 6.4.10 Koppert Biological Systems Inc.
- 6.4.11 Lallemand Inc.
- 6.4.12 Marrone Bio Innovations Inc.
- 6.4.13 Seipasa SA
- 6.4.14 T Stanes and Company Limited
- 6.4.15 Valent Biosciences LLC
7. KEY STRATEGIC QUESTIONS FOR AGRICULTURAL BIOLOGICALS CEOS
8. APPENDIX
- 8.1 Global Overview
- 8.1.1 Overview
- 8.1.2 Porter’s Five Forces Framework
- 8.1.3 Global Value Chain Analysis
- 8.1.4 Market Dynamics (DROs)
- 8.2 Sources & References
- 8.3 List of Tables & Figures
- 8.4 Primary Insights
- 8.5 Data Pack
- 8.6 Glossary of Terms
List of Tables & Figures
- Figure 1:
- AREA UNDER ORGANIC CULTIVATION IN HECTARES, GLOBAL, 2017 – 2022
- Figure 2:
- PER CAPITA SPENDING ON ORGANIC PRODUCTS IN USD, GLOBAL, 2017 – 2022
- Figure 3:
- GLOBAL BIOPESTICIDES MARKET, VOLUME, METRIC TON, 2017 – 2029
- Figure 4:
- GLOBAL BIOPESTICIDES MARKET, VALUE, USD, 2017 – 2029
- Figure 5:
- BIOPESTICIDES CONSUMPTION IN METRIC TON, GLOBAL, 2017 – 2029
- Figure 6:
- BIOPESTICIDES CONSUMPTION IN USD, GLOBAL, 2017 – 2029
- Figure 7:
- BIOPESTICIDES CONSUMPTION VOLUME BY FORM IN %, GLOBAL, 2017 VS 2023 VS 2029
- Figure 8:
- BIOPESTICIDES CONSUMPTION VALUE BY FORM IN %, GLOBAL, 2017 VS 2023 VS 2029
- Figure 9:
- BIOFUNGICIDES CONSUMPTION IN METRIC TON, GLOBAL, 2017 – 2029
- Figure 10:
- BIOFUNGICIDES CONSUMPTION IN USD, GLOBAL, 2017 – 2029
- Figure 11:
- BIOFUNGICIDES CONSUMPTION VALUE BY CROP TYPE IN %, GLOBAL, 2022 VS 2029
- Figure 12:
- BIOHERBICIDES CONSUMPTION IN METRIC TON, GLOBAL, 2017 – 2029
- Figure 13:
- BIOHERBICIDES CONSUMPTION IN USD, GLOBAL, 2017 – 2029
- Figure 14:
- BIOHERBICIDES CONSUMPTION VALUE BY CROP TYPE IN %, GLOBAL, 2022 VS 2029
- Figure 15:
- BIOINSECTICIDES CONSUMPTION IN METRIC TON, GLOBAL, 2017 – 2029
- Figure 16:
- BIOINSECTICIDES CONSUMPTION IN USD, GLOBAL, 2017 – 2029
- Figure 17:
- BIOINSECTICIDES CONSUMPTION VALUE BY CROP TYPE IN %, GLOBAL, 2022 VS 2029
- Figure 18:
- OTHER BIOPESTICIDES CONSUMPTION IN METRIC TON, GLOBAL, 2017 – 2029
- Figure 19:
- OTHER BIOPESTICIDES CONSUMPTION IN USD, GLOBAL, 2017 – 2029
- Figure 20:
- OTHER BIOPESTICIDES CONSUMPTION VALUE BY CROP TYPE IN %, GLOBAL, 2022 VS 2029
- Figure 21:
- BIOPESTICIDES CONSUMPTION IN METRIC TON, GLOBAL, 2017 – 2029
- Figure 22:
- BIOPESTICIDES CONSUMPTION IN USD, GLOBAL, 2017 – 2029
- Figure 23:
- BIOPESTICIDES CONSUMPTION VOLUME BY CROP TYPE IN %, GLOBAL, 2017 VS 2023 VS 2029
- Figure 24:
- BIOPESTICIDES CONSUMPTION VALUE BY CROP TYPE IN %, GLOBAL, 2017 VS 2023 VS 2029
- Figure 25:
- BIOPESTICIDES CONSUMPTION BY CASH CROPS IN METRIC TON, GLOBAL, 2017 – 2029
- Figure 26:
- BIOPESTICIDES CONSUMPTION BY CASH CROPS IN USD, GLOBAL, 2017 – 2029
- Figure 27:
- BIOPESTICIDES CONSUMPTION VALUE BY FORM IN %, GLOBAL, 2022 VS 2029
- Figure 28:
- BIOPESTICIDES CONSUMPTION BY HORTICULTURAL CROPS IN METRIC TON, GLOBAL, 2017 – 2029
- Figure 29:
- BIOPESTICIDES CONSUMPTION BY HORTICULTURAL CROPS IN USD, GLOBAL, 2017 – 2029
- Figure 30:
- BIOPESTICIDES CONSUMPTION VALUE BY FORM IN %, GLOBAL, 2022 VS 2029
- Figure 31:
- BIOPESTICIDES CONSUMPTION BY ROW CROPS IN METRIC TON, GLOBAL, 2017 – 2029
- Figure 32:
- BIOPESTICIDES CONSUMPTION BY ROW CROPS IN USD, GLOBAL, 2017 – 2029
- Figure 33:
- BIOPESTICIDES CONSUMPTION VALUE BY FORM IN %, GLOBAL, 2022 VS 2029
- Figure 34:
- BIOPESTICIDES CONSUMPTION IN METRIC TON, GLOBAL, 2017 – 2029
- Figure 35:
- BIOPESTICIDES CONSUMPTION IN USD, GLOBAL, 2017 – 2029
- Figure 36:
- BIOPESTICIDES CONSUMPTION VOLUME BY REGION IN %, GLOBAL, 2017 VS 2023 VS 2029
- Figure 37:
- BIOPESTICIDES CONSUMPTION VALUE BY REGION IN %, GLOBAL, 2017 VS 2023 VS 2029
- Figure 38:
- BIOPESTICIDES CONSUMPTION IN METRIC TON, AFRICA, 2017 – 2029
- Figure 39:
- BIOPESTICIDES CONSUMPTION IN USD, AFRICA, 2017 – 2029
- Figure 40:
- BIOPESTICIDES CONSUMPTION VOLUME BY COUNTRY IN %, AFRICA, 2017 VS 2023 VS 2029
- Figure 41:
- BIOPESTICIDES CONSUMPTION VALUE BY COUNTRY IN %, AFRICA, 2017 VS 2023 VS 2029
- Figure 42:
- BIOPESTICIDES CONSUMPTION IN METRIC TON, EGYPT, 2017 – 2029
- Figure 43:
- BIOPESTICIDES CONSUMPTION IN USD, EGYPT, 2017 – 2029
- Figure 44:
- BIOPESTICIDES CONSUMPTION VALUE BY FORM IN %, EGYPT, 2022 VS 2029
- Figure 45:
- BIOPESTICIDES CONSUMPTION IN METRIC TON, NIGERIA, 2017 – 2029
- Figure 46:
- BIOPESTICIDES CONSUMPTION IN USD, NIGERIA, 2017 – 2029
- Figure 47:
- BIOPESTICIDES CONSUMPTION VALUE BY FORM IN %, NIGERIA, 2022 VS 2029
- Figure 48:
- BIOPESTICIDES CONSUMPTION IN METRIC TON, SOUTH AFRICA, 2017 – 2029
- Figure 49:
- BIOPESTICIDES CONSUMPTION IN USD, SOUTH AFRICA, 2017 – 2029
- Figure 50:
- BIOPESTICIDES CONSUMPTION VALUE BY FORM IN %, SOUTH AFRICA, 2022 VS 2029
- Figure 51:
- BIOPESTICIDES CONSUMPTION IN METRIC TON, REST OF AFRICA, 2017 – 2029
- Figure 52:
- BIOPESTICIDES CONSUMPTION IN USD, REST OF AFRICA, 2017 – 2029
- Figure 53:
- BIOPESTICIDES CONSUMPTION VALUE BY FORM IN %, REST OF AFRICA, 2022 VS 2029
- Figure 54:
- BIOPESTICIDES CONSUMPTION IN METRIC TON, ASIA-PACIFIC, 2017 – 2029
- Figure 55:
- BIOPESTICIDES CONSUMPTION IN USD, ASIA-PACIFIC, 2017 – 2029
- Figure 56:
- BIOPESTICIDES CONSUMPTION VOLUME BY COUNTRY IN %, ASIA-PACIFIC, 2017 VS 2023 VS 2029
- Figure 57:
- BIOPESTICIDES CONSUMPTION VALUE BY COUNTRY IN %, ASIA-PACIFIC, 2017 VS 2023 VS 2029
- Figure 58:
- BIOPESTICIDES CONSUMPTION IN METRIC TON, AUSTRALIA, 2017 – 2029
- Figure 59:
- BIOPESTICIDES CONSUMPTION IN USD, AUSTRALIA, 2017 – 2029
- Figure 60:
- BIOPESTICIDES CONSUMPTION VALUE BY FORM IN %, AUSTRALIA, 2022 VS 2029
- Figure 61:
- BIOPESTICIDES CONSUMPTION IN METRIC TON, CHINA, 2017 – 2029
- Figure 62:
- BIOPESTICIDES CONSUMPTION IN USD, CHINA, 2017 – 2029
- Figure 63:
- BIOPESTICIDES CONSUMPTION VALUE BY FORM IN %, CHINA, 2022 VS 2029
- Figure 64:
- BIOPESTICIDES CONSUMPTION IN METRIC TON, INDIA, 2017 – 2029
- Figure 65:
- BIOPESTICIDES CONSUMPTION IN USD, INDIA, 2017 – 2029
- Figure 66:
- BIOPESTICIDES CONSUMPTION VALUE BY FORM IN %, INDIA, 2022 VS 2029
- Figure 67:
- BIOPESTICIDES CONSUMPTION IN METRIC TON, INDONESIA, 2017 – 2029
- Figure 68:
- BIOPESTICIDES CONSUMPTION IN USD, INDONESIA, 2017 – 2029
- Figure 69:
- BIOPESTICIDES CONSUMPTION VALUE BY FORM IN %, INDONESIA, 2022 VS 2029
- Figure 70:
- BIOPESTICIDES CONSUMPTION IN METRIC TON, JAPAN, 2017 – 2029
- Figure 71:
- BIOPESTICIDES CONSUMPTION IN USD, JAPAN, 2017 – 2029
- Figure 72:
- BIOPESTICIDES CONSUMPTION VALUE BY FORM IN %, JAPAN, 2022 VS 2029
- Figure 73:
- BIOPESTICIDES CONSUMPTION IN METRIC TON, PHILIPPINES, 2017 – 2029
- Figure 74:
- BIOPESTICIDES CONSUMPTION IN USD, PHILIPPINES, 2017 – 2029
- Figure 75:
- BIOPESTICIDES CONSUMPTION VALUE BY FORM IN %, PHILIPPINES, 2022 VS 2029
- Figure 76:
- BIOPESTICIDES CONSUMPTION IN METRIC TON, THAILAND, 2017 – 2029
- Figure 77:
- BIOPESTICIDES CONSUMPTION IN USD, THAILAND, 2017 – 2029
- Figure 78:
- BIOPESTICIDES CONSUMPTION VALUE BY FORM IN %, THAILAND, 2022 VS 2029
- Figure 79:
- BIOPESTICIDES CONSUMPTION IN METRIC TON, VIETNAM, 2017 – 2029
- Figure 80:
- BIOPESTICIDES CONSUMPTION IN USD, VIETNAM, 2017 – 2029
- Figure 81:
- BIOPESTICIDES CONSUMPTION VALUE BY FORM IN %, VIETNAM, 2022 VS 2029
- Figure 82:
- BIOPESTICIDES CONSUMPTION IN METRIC TON, REST OF ASIA-PACIFIC, 2017 – 2029
- Figure 83:
- BIOPESTICIDES CONSUMPTION IN USD, REST OF ASIA-PACIFIC, 2017 – 2029
- Figure 84:
- BIOPESTICIDES CONSUMPTION VALUE BY FORM IN %, REST OF ASIA-PACIFIC, 2022 VS 2029
- Figure 85:
- BIOPESTICIDES CONSUMPTION IN METRIC TON, EUROPE, 2017 – 2029
- Figure 86:
- BIOPESTICIDES CONSUMPTION IN USD, EUROPE, 2017 – 2029
- Figure 87:
- BIOPESTICIDES CONSUMPTION VOLUME BY COUNTRY IN %, EUROPE, 2017 VS 2023 VS 2029
- Figure 88:
- BIOPESTICIDES CONSUMPTION VALUE BY COUNTRY IN %, EUROPE, 2017 VS 2023 VS 2029
- Figure 89:
- BIOPESTICIDES CONSUMPTION IN METRIC TON, FRANCE, 2017 – 2029
- Figure 90:
- BIOPESTICIDES CONSUMPTION IN USD, FRANCE, 2017 – 2029
- Figure 91:
- BIOPESTICIDES CONSUMPTION VALUE BY FORM IN %, FRANCE, 2022 VS 2029
- Figure 92:
- BIOPESTICIDES CONSUMPTION IN METRIC TON, GERMANY, 2017 – 2029
- Figure 93:
- BIOPESTICIDES CONSUMPTION IN USD, GERMANY, 2017 – 2029
- Figure 94:
- BIOPESTICIDES CONSUMPTION VALUE BY FORM IN %, GERMANY, 2022 VS 2029
- Figure 95:
- BIOPESTICIDES CONSUMPTION IN METRIC TON, ITALY, 2017 – 2029
- Figure 96:
- BIOPESTICIDES CONSUMPTION IN USD, ITALY, 2017 – 2029
- Figure 97:
- BIOPESTICIDES CONSUMPTION VALUE BY FORM IN %, ITALY, 2022 VS 2029
- Figure 98:
- BIOPESTICIDES CONSUMPTION IN METRIC TON, NETHERLANDS, 2017 – 2029
- Figure 99:
- BIOPESTICIDES CONSUMPTION IN USD, NETHERLANDS, 2017 – 2029
- Figure 100:
- BIOPESTICIDES CONSUMPTION VALUE BY FORM IN %, NETHERLANDS, 2022 VS 2029
- Figure 101:
- BIOPESTICIDES CONSUMPTION IN METRIC TON, RUSSIA, 2017 – 2029
- Figure 102:
- BIOPESTICIDES CONSUMPTION IN USD, RUSSIA, 2017 – 2029
- Figure 103:
- BIOPESTICIDES CONSUMPTION VALUE BY FORM IN %, RUSSIA, 2022 VS 2029
- Figure 104:
- BIOPESTICIDES CONSUMPTION IN METRIC TON, SPAIN, 2017 – 2029
- Figure 105:
- BIOPESTICIDES CONSUMPTION IN USD, SPAIN, 2017 – 2029
- Figure 106:
- BIOPESTICIDES CONSUMPTION VALUE BY FORM IN %, SPAIN, 2022 VS 2029
- Figure 107:
- BIOPESTICIDES CONSUMPTION IN METRIC TON, TURKEY, 2017 – 2029
- Figure 108:
- BIOPESTICIDES CONSUMPTION IN USD, TURKEY, 2017 – 2029
- Figure 109:
- BIOPESTICIDES CONSUMPTION VALUE BY FORM IN %, TURKEY, 2022 VS 2029
- Figure 110:
- BIOPESTICIDES CONSUMPTION IN METRIC TON, UNITED KINGDOM, 2017 – 2029
- Figure 111:
- BIOPESTICIDES CONSUMPTION IN USD, UNITED KINGDOM, 2017 – 2029
- Figure 112:
- BIOPESTICIDES CONSUMPTION VALUE BY FORM IN %, UNITED KINGDOM, 2022 VS 2029
- Figure 113:
- BIOPESTICIDES CONSUMPTION IN METRIC TON, REST OF EUROPE, 2017 – 2029
- Figure 114:
- BIOPESTICIDES CONSUMPTION IN USD, REST OF EUROPE, 2017 – 2029
- Figure 115:
- BIOPESTICIDES CONSUMPTION VALUE BY FORM IN %, REST OF EUROPE, 2022 VS 2029
- Figure 116:
- BIOPESTICIDES CONSUMPTION IN METRIC TON, MIDDLE EAST, 2017 – 2029
- Figure 117:
- BIOPESTICIDES CONSUMPTION IN USD, MIDDLE EAST, 2017 – 2029
- Figure 118:
- BIOPESTICIDES CONSUMPTION VOLUME BY COUNTRY IN %, MIDDLE EAST, 2017 VS 2023 VS 2029
- Figure 119:
- BIOPESTICIDES CONSUMPTION VALUE BY COUNTRY IN %, MIDDLE EAST, 2017 VS 2023 VS 2029
- Figure 120:
- BIOPESTICIDES CONSUMPTION IN METRIC TON, IRAN, 2017 – 2029
- Figure 121:
- BIOPESTICIDES CONSUMPTION IN USD, IRAN, 2017 – 2029
- Figure 122:
- BIOPESTICIDES CONSUMPTION VALUE BY FORM IN %, IRAN, 2022 VS 2029
- Figure 123:
- BIOPESTICIDES CONSUMPTION IN METRIC TON, SAUDI ARABIA, 2017 – 2029
- Figure 124:
- BIOPESTICIDES CONSUMPTION IN USD, SAUDI ARABIA, 2017 – 2029
- Figure 125:
- BIOPESTICIDES CONSUMPTION VALUE BY FORM IN %, SAUDI ARABIA, 2022 VS 2029
- Figure 126:
- BIOPESTICIDES CONSUMPTION IN METRIC TON, REST OF MIDDLE EAST, 2017 – 2029
- Figure 127:
- BIOPESTICIDES CONSUMPTION IN USD, REST OF MIDDLE EAST, 2017 – 2029
- Figure 128:
- BIOPESTICIDES CONSUMPTION VALUE BY FORM IN %, REST OF MIDDLE EAST, 2022 VS 2029
- Figure 129:
- BIOPESTICIDES CONSUMPTION IN METRIC TON, NORTH AMERICA, 2017 – 2029
- Figure 130:
- BIOPESTICIDES CONSUMPTION IN USD, NORTH AMERICA, 2017 – 2029
- Figure 131:
- BIOPESTICIDES CONSUMPTION VOLUME BY COUNTRY IN %, NORTH AMERICA, 2017 VS 2023 VS 2029
- Figure 132:
- BIOPESTICIDES CONSUMPTION VALUE BY COUNTRY IN %, NORTH AMERICA, 2017 VS 2023 VS 2029
- Figure 133:
- BIOPESTICIDES CONSUMPTION IN METRIC TON, CANADA, 2017 – 2029
- Figure 134:
- BIOPESTICIDES CONSUMPTION IN USD, CANADA, 2017 – 2029
- Figure 135:
- BIOPESTICIDES CONSUMPTION VALUE BY FORM IN %, CANADA, 2022 VS 2029
- Figure 136:
- BIOPESTICIDES CONSUMPTION IN METRIC TON, MEXICO, 2017 – 2029
- Figure 137:
- BIOPESTICIDES CONSUMPTION IN USD, MEXICO, 2017 – 2029
- Figure 138:
- BIOPESTICIDES CONSUMPTION VALUE BY FORM IN %, MEXICO, 2022 VS 2029
- Figure 139:
- BIOPESTICIDES CONSUMPTION IN METRIC TON, UNITED STATES, 2017 – 2029
- Figure 140:
- BIOPESTICIDES CONSUMPTION IN USD, UNITED STATES, 2017 – 2029
- Figure 141:
- BIOPESTICIDES CONSUMPTION VALUE BY FORM IN %, UNITED STATES, 2022 VS 2029
- Figure 142:
- BIOPESTICIDES CONSUMPTION IN METRIC TON, REST OF NORTH AMERICA, 2017 – 2029
- Figure 143:
- BIOPESTICIDES CONSUMPTION IN USD, REST OF NORTH AMERICA, 2017 – 2029
- Figure 144:
- BIOPESTICIDES CONSUMPTION VALUE BY FORM IN %, REST OF NORTH AMERICA, 2022 VS 2029
- Figure 145:
- BIOPESTICIDES CONSUMPTION IN METRIC TON, SOUTH AMERICA, 2017 – 2029
- Figure 146:
- BIOPESTICIDES CONSUMPTION IN USD, SOUTH AMERICA, 2017 – 2029
- Figure 147:
- BIOPESTICIDES CONSUMPTION VOLUME BY COUNTRY IN %, SOUTH AMERICA, 2017 VS 2023 VS 2029
- Figure 148:
- BIOPESTICIDES CONSUMPTION VALUE BY COUNTRY IN %, SOUTH AMERICA, 2017 VS 2023 VS 2029
- Figure 149:
- BIOPESTICIDES CONSUMPTION IN METRIC TON, ARGENTINA, 2017 – 2029
- Figure 150:
- BIOPESTICIDES CONSUMPTION IN USD, ARGENTINA, 2017 – 2029
- Figure 151:
- BIOPESTICIDES CONSUMPTION VALUE BY FORM IN %, ARGENTINA, 2022 VS 2029
- Figure 152:
- BIOPESTICIDES CONSUMPTION IN METRIC TON, BRAZIL, 2017 – 2029
- Figure 153:
- BIOPESTICIDES CONSUMPTION IN USD, BRAZIL, 2017 – 2029
- Figure 154:
- BIOPESTICIDES CONSUMPTION VALUE BY FORM IN %, BRAZIL, 2022 VS 2029
- Figure 155:
- BIOPESTICIDES CONSUMPTION IN METRIC TON, REST OF SOUTH AMERICA, 2017 – 2029
- Figure 156:
- BIOPESTICIDES CONSUMPTION IN USD, REST OF SOUTH AMERICA, 2017 – 2029
- Figure 157:
- BIOPESTICIDES CONSUMPTION VALUE BY FORM IN %, REST OF SOUTH AMERICA, 2022 VS 2029
- Figure 158:
- GLOBAL BIOPESTICIDES MARKET, MOST ACTIVE COMPANIES, BY NUMBER OF STRATEGIC MOVES, 2017-2022
- Figure 159:
- GLOBAL BIOPESTICIDES MARKET, MOST ADOPTED STRATEGIES, 2017-2022
- Figure 160:
- GLOBAL BIOPESTICIDES MARKET SHARE(%), BY MAJOR PLAYERS
Biopesticides Industry Segmentation
Biofungicides, Bioherbicides, Bioinsecticides are covered as segments by Form. Cash Crops, Horticultural Crops, Row Crops are covered as segments by Crop Type. Africa, Asia-Pacific, Europe, Middle East, North America, South America are covered as segments by Region.
- Biopesticides are made from natural materials such as animals, plants, bacteria, and certain minerals. They are used to control pests in an environmentally friendly way by harnessing natural mechanisms of control. Biopesticides are often selective, and they target specific pests, thereby reducing the impact on non-target species and the environment. Biopesticides are also typically less toxic to humans and animals, and they break down more quickly in the environment.
- Biofungicides are the most popularly used biopesticides. They held a market share of 47.6% in 2022. Bacillus, Trichoderma, Streptomyces, and Pseudomonas are the most commercially used species of microorganisms in agriculture. These biofungicides effectively act against pathogens, such as Pythium, Rhizoctonia, Fusarium, Sclerotinia, Thielaviopsis, Botrytis, and powdery mildew.
- Bioinsecticides accounted for 27.9% of the global biopesticides market in 2022. There are several pests that cause devastating losses to specific crops in each season, which can be effectively controlled by using target-specific bioinsecticides. For instance, cotton is an important cash crop grown globally. The cotton bollworm pest affects the yield of cotton plants, irrespective of the region. Bacillus thuringiensis, a commercially important bioinsecticide, is known to effectively control this devastating pest that can cause potential yield losses of 30-90%.
- The effectiveness of biopesticides in controlling target-specific pests and diseases with no harm to the environment and animals is expected to drive the global market for biopesticides. The biopesticides market is estimated to register a CAGR of 11.0% between 2023 and 2029.
| Form | Biofungicides | ||
| Bioherbicides | |||
| Bioinsecticides | |||
| Other Biopesticides | |||
| Crop Type | Cash Crops | ||
| Horticultural Crops | |||
| Row Crops | |||
| Region | Africa | By Country | Egypt |
| Nigeria | |||
| South Africa | |||
| Rest of Africa | |||
| Region | Asia-Pacific | By Country | Australia |
| China | |||
| India | |||
| Indonesia | |||
| Japan | |||
| Philippines | |||
| Thailand | |||
| Vietnam | |||
| Rest of Asia-Pacific | |||
| Region | Europe | By Country | France |
| Germany | |||
| Italy | |||
| Netherlands | |||
| Russia | |||
| Spain | |||
| Turkey | |||
| United Kingdom | |||
| Rest of Europe | |||
| Region | Middle East | By Country | Iran |
| Saudi Arabia | |||
| Rest of Middle East | |||
| Region | North America | By Country | Canada |
| Mexico | |||
| United States | |||
| Rest of North America | |||
| Region | South America | By Country | Argentina |
| Brazil | |||
| Rest of South America |
Market Definition
- AVERAGE DOSAGE RATE – The average application rate is the average volume of biopesticides applied per hectare of farmland in the respective region/country.
- CROP TYPE – Crop type includes Row crops (Cereals, Pulses, Oilseeds), Horticultural Crops (Fruits and vegetables) and Cash Crops (Plantation Crops, Fibre Crops and Other Industrial Crops)
- FUNCTION – The Crop Protection function of agirucultural biological include products that prevent or control various biotic and abiotic stress.
- TYPE – Biopesticides prevent or control various pests, including insects, diseases, and weeds, from causing crop damage and yield loss.
| Keyword | Definition |
|---|---|
| Cash Crops | Cash crops are non-consumable crops sold as a whole or part of the crop to manufacture end-products to make a profit. |
| Integrated Pest Management (IPM) | IPM is an environment-friendly and sustainable approach to control pests in various crops. It involves a combination of methods, including biological controls, cultural practices, and selective use of pesticides. |
| Bacterial biocontrol agents | Bacteria used to control pests and diseases in crops. They work by producing toxins harmful to the target pests or competing with them for nutrients and space in the growing environment. Some examples of commonly used bacterial biocontrol agents include Bacillus thuringiensis (Bt), Pseudomonas fluorescens, and Streptomyces spp. |
| Plant Protection Product (PPP) | A plant protection product is a formulation applied to crops to protect from pests, such as weeds, diseases, or insects. They contain one or more active substances with other co-formulants such as solvents, carriers, inert material, wetting agents or adjuvants formulated to give optimum product efficacy. |
| Pathogen | A pathogen is an organism causing disease to its host, with the severity of the disease symptoms. |
| Parasitoids | Parasitoids are insects that lay their eggs on or within the host insect, with their larvae feeding on the host insect. In agriculture, parasitoids can be used as a form of biological pest control, as they help to control pest damage to crops and decrease the need for chemical pesticides. |
| Entomopathogenic Nematodes (EPN) | Entomopathogenic nematodes are parasitic roundworms that infect and kill pests by releasing bacteria from their gut. Entomopathogenic nematodes are a form of biocontrol agents used in agriculture. |
| Vesicular-arbuscular mycorrhiza (VAM) | VAM fungi are mycorrhizal species of fungus. They live in the roots of different higher-order plants. They develop a symbiotic relationship with the plants in the roots of these plants. |
| Fungal biocontrol agents | Fungal biocontrol agents are the beneficial fungi that control plant pests and diseases. They are an alternative to chemical pesticides. They infect and kill the pests or compete with pathogenic fungi for nutrients and space. |
| Biofertilizers | Biofertilizers contain beneficial microorganisms that enhance soil fertility and promote plant growth. |
| Biopesticides | Biopesticides are natural/bio-based compounds used to manage agricultural pests using specific biological effects. |
| Predators | Predators in agriculture are the organisms that feed on pests and help control pest damage to the crops. Some common predator species used in agriculture include ladybugs, lacewings, and predatory mites. |
| Biocontrol agents | Biocontrol agents are living organisms used to control pests and diseases in agriculture. They are alternatives to chemical pesticides and are known for their lesser impact on the environment and human health. |
| Organic Fertilizers | Organic fertilizer is composed of animal or vegetable matter used alone or in combination with one or more non-synthetically derived elements or compounds used for soil fertility and plant growth. |
| Protein hydrolysates (PHs) | Protein hydrolysate-based biostimulants contain free amino acids, oligopeptides, and polypeptides produced by enzymatic or chemical hydrolysis of proteins, primarily from vegetal or animal sources. |
| Biostimulants/Plant Growth Regulators (PGR) | Biostimulants/Plant Growth Regulators (PGR) are substances derived from natural resources to enhance plant growth and health by stimulating plant processes (metabolism). |
| Soil Amendments | Soil Amendments are substances applied to soil that improve soil health, such as soil fertility and soil structure. |
| Seaweed Extract | Seaweed extracts are rich in micro and macronutrients, proteins, polysaccharides, polyphenols, phytohormones, and osmolytes. These substances boost seed germination and crop establishment, total plant growth and productivity. |
| Compounds related to biocontrol and/or promoting growth (CRBPG) | Compounds related to biocontrol or promoting growth (CRBPG) are the ability of a bacteria to produce compounds for phytopathogen biocontrol and plant growth promotion. |
| Symbiotic Nitrogen-Fixing Bacteria | Symbiotic nitrogen-fixing bacteria such as Rhizobium obtain food and shelter from the host, and in return, they help by providing fixed nitrogen to the plants. |
| Nitrogen Fixation | Nitrogen fixation is a chemical process in soil which converts molecular nitrogen into ammonia or related nitrogenous compounds. |
| ARS (Agricultural Research Service) | ARS is the U.S. Department of Agriculture’s chief scientific in-house research agency. It aims to find solutions to agricultural problems faced by the farmers in the country. |
| Phytosanitary Regulations | Phytosanitary regulations imposed by the respective government bodies check or prohibit the importation and marketing of certain insects, plant species, or products of these plants to prevent the introduction or spread of new plant pests or pathogens. |
| Ectomycorrhizae (ECM) | Ectomycorrhiza (ECM) is a symbiotic interaction of fungi with the feeder roots of higher plants in which both the plant and the fungi benefit through the association for survival. |
Biopesticides Market Research FAQs
How big is the Global Biopesticides Market?
The Global Biopesticides Market size is expected to reach USD 6.72 billion in 2025 and grow at a CAGR of 11.19% to reach USD 11.41 billion by 2030.
What is the current Global Biopesticides Market size?
In 2025, the Global Biopesticides Market size is expected to reach USD 6.72 billion.
Who are the key players in Global Biopesticides Market?
Corteva Agriscience, Gujarat State Fertilizers & Chemicals Ltd, Koppert Biological Systems Inc., Marrone Bio Innovations Inc. and Valent Biosciences LLC are the major companies operating in the Global Biopesticides Market.
Which segment has the biggest share in the Global Biopesticides Market?
In the Global Biopesticides Market, the Biofungicides segment accounts for the largest share by form.
Which region has the biggest share in the Global Biopesticides Market?
In 2025, North America accounts for the largest share by region in the Global Biopesticides Market.
What years does this Global Biopesticides Market cover, and what was the market size in 2025?
In 2025, the Global Biopesticides Market size was estimated at 6.72 billion. The report covers the Global Biopesticides Market historical market size for years: 2017, 2018, 2019, 2020, 2021, 2022, 2023 and 2024. The report also forecasts the Global Biopesticides Market size for years: 2025, 2026, 2027, 2028, 2029 and 2030.